Vietnam Coffee: See Supply Risk Before It Moves The Price
Treefera's Vietnam Coffee Production Area Forecast is a satellite-derived map of the coffee footprint across the four Central Highlands provinces that grow about 90% of national output, refreshed with a weekly Weather Stress Score applied to confirmed coffee area. It tracks official government figures within 15% and lands 9-18 months before they publish.
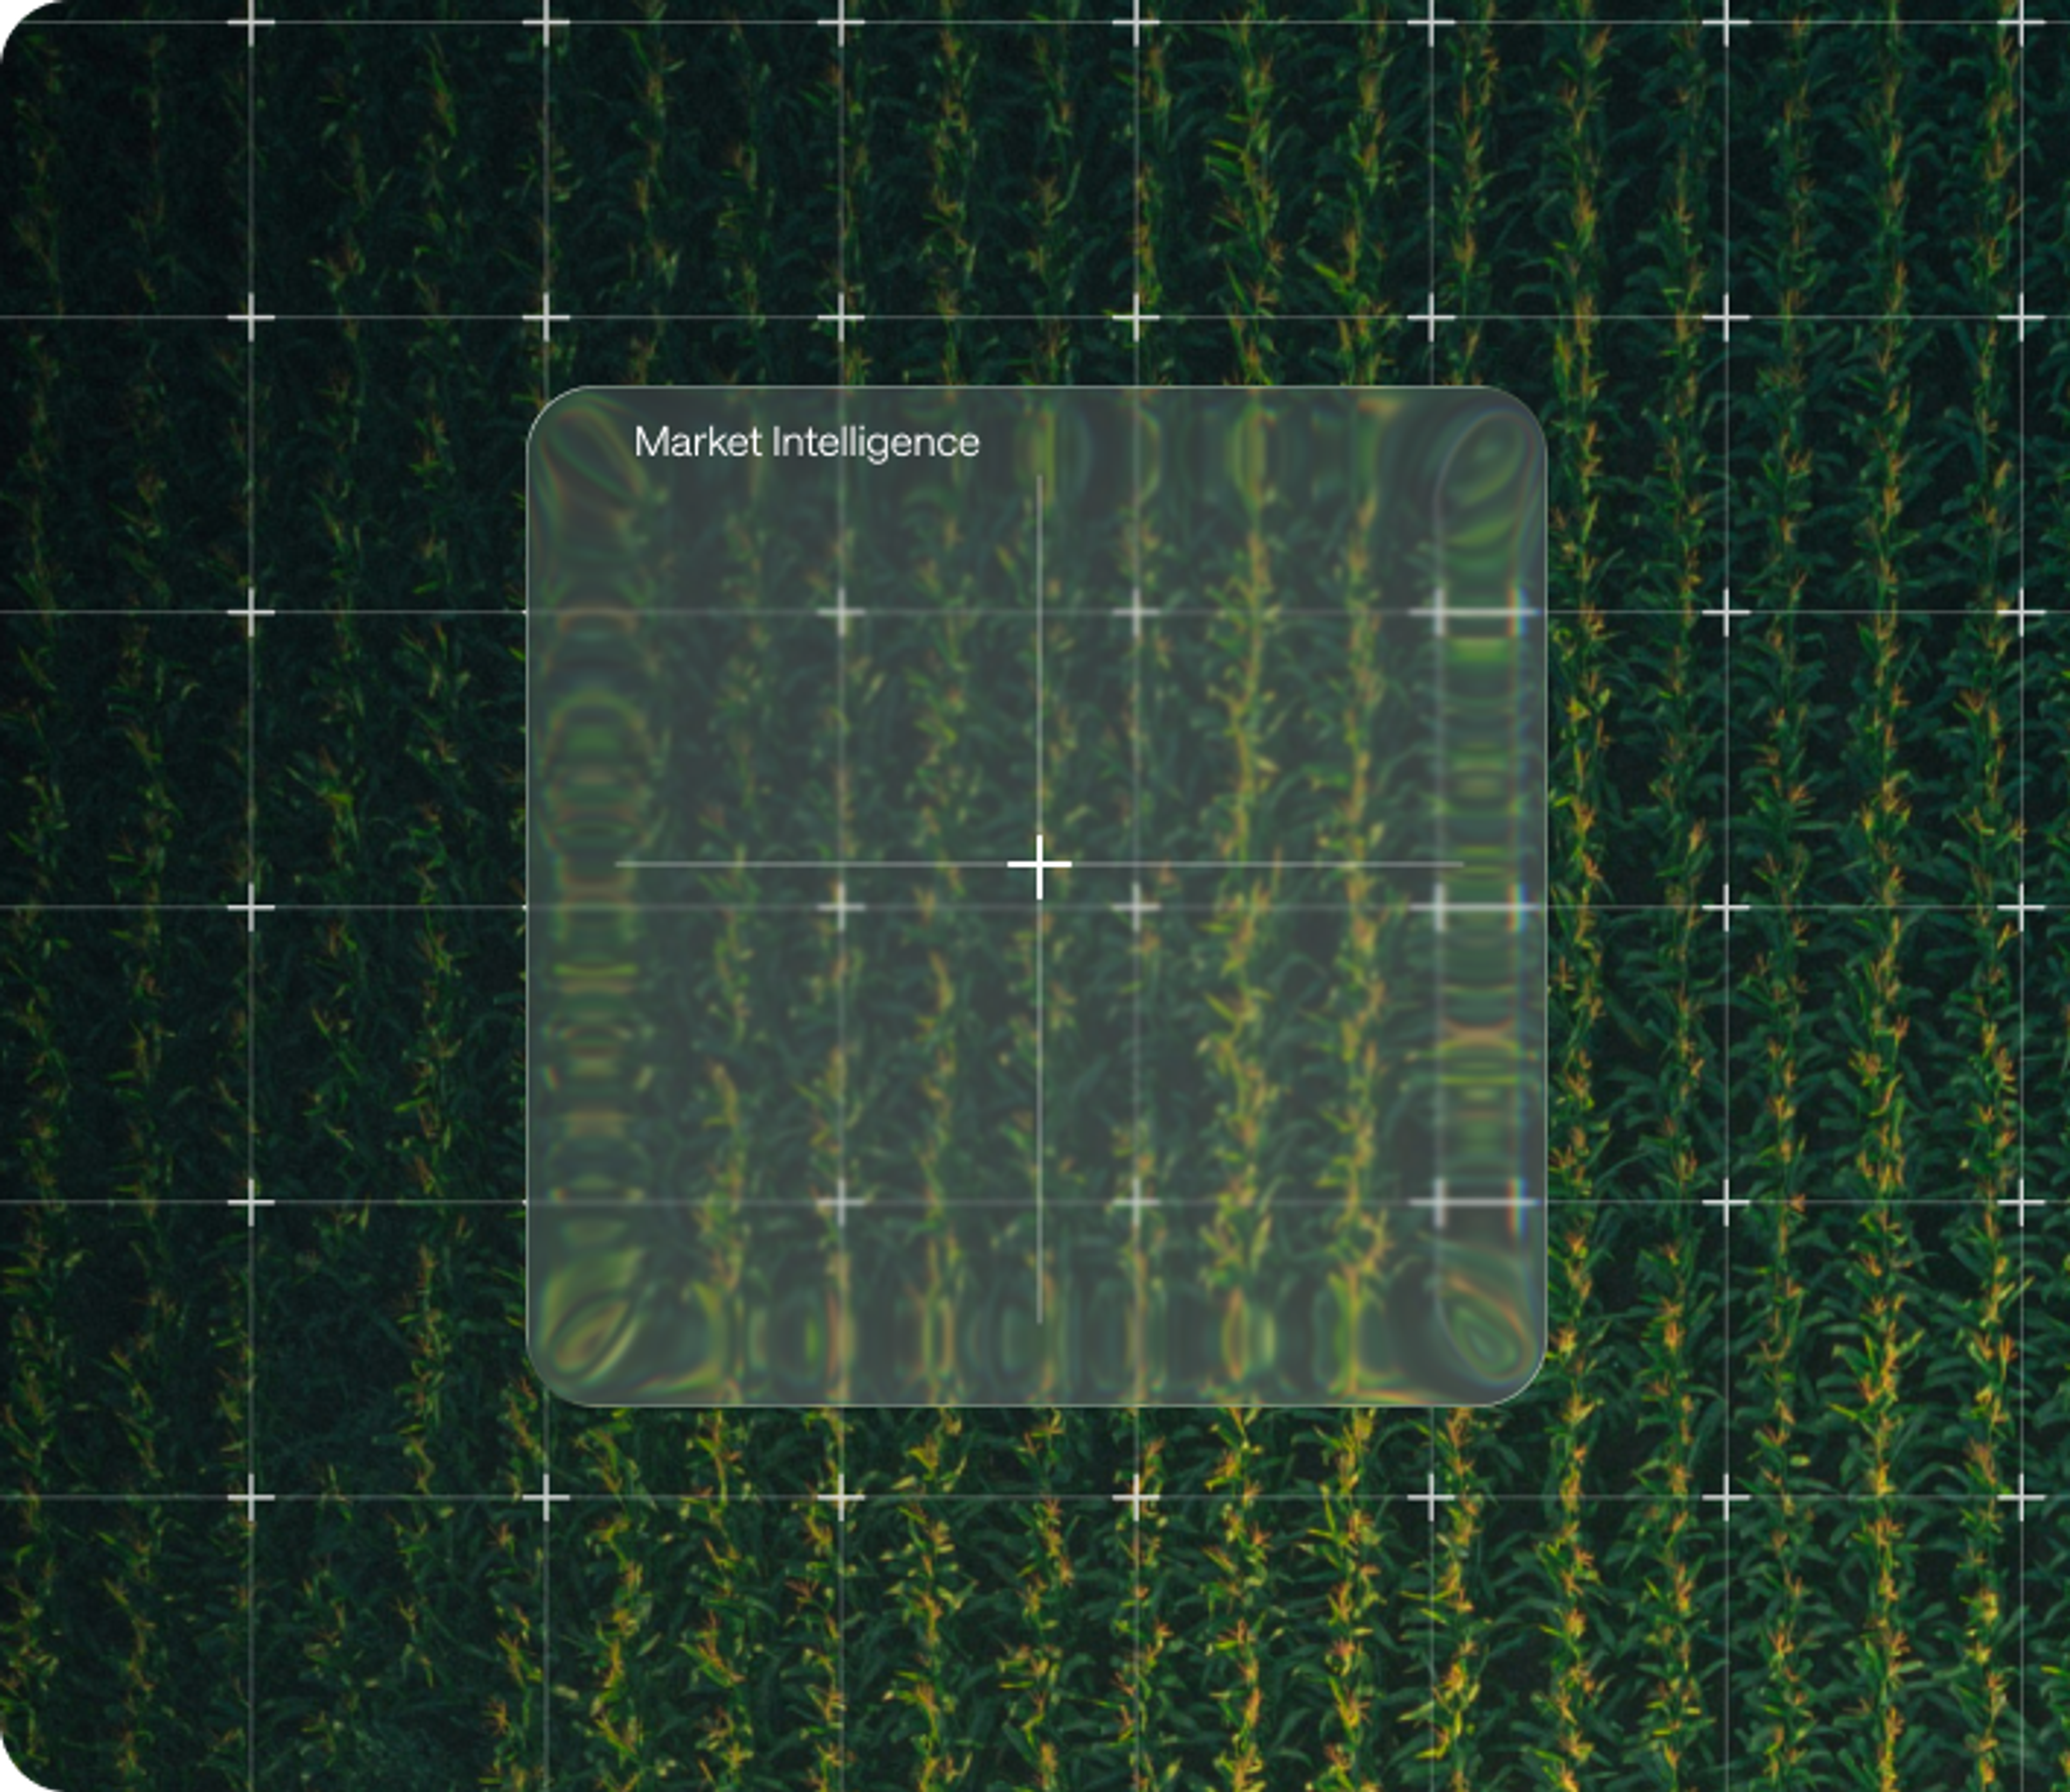

The same accuracy as official statistics, at district level, 9-18 months before they publish
Vietnam's official coffee statistics - MARD/GSO, USDA FAS, FAOSTAT - all trace to one upstream source that publishes 9-18 months after the crop year closes. By the time the market has confirmed what happened to supply, every critical risk window has already passed.
Treefera maps Vietnam's coffee production footprint at district level across the four Central Highlands provinces that produce about 90% of national output, with a weekly Weather Stress Score applied to confirmed coffee area. Not what happened to a province, but what the weather is doing to the coffee inside it.
Backtested against the November 2025 floods, when the market was pricing a supply catastrophe, Treefera's footprint showed over 99% of Vietnam's producing area was untouched. That distinction is only possible with a verified map of where the coffee actually is.
>99%
Untouched. in a backtest of the November 2025 floods, only 0.09% of detected coffee area (630 ha of 738,813 ha) saw standing water, while the market priced a supply catastrophe
9-18
months earlier than MARD/GSO's official provincial statistics, the single upstream source USDA FAS and FAOSTAT both trace back to. For that window Treefera is the only source
15%
detected area sits within 15% of official MARD/GSO figures across the two most productive provinces, every year 2020-2024, same model, no retraining

Backtested against the November 2025 floods: the market priced a supply catastrophe, Treefera's footprint showed over 99% of the coffee was untouched.
In November 2025, storms hit the Central Highlands during peak Robusta harvest and exports fell 47% year-on-year. With Robusta prices near a record high of about $5,821/t, the market priced in a production catastrophe. Run against Treefera's verified footprint, standing water intersected just 0.09% of detected coffee area - 630 ha of 738,813 ha. Coffee is grown on elevated terrain above the flood zone, so the real damage was quality loss during cherry drying, a one-season disruption rather than structural tree damage. A client tracking this signal would have seen the production base was intact while the market was still pricing a disaster.
The advantage does not come from watching the weather, it comes from knowing where the coffee is. Field reports said "Dak Lak was affected" but could not quantify how much coffee was actually exposed. A weather dashboard showed conditions over the whole province. Only a coffee-specific footprint could separate the 0.09% that flooded from the more than 99% that did not, across 738,000 ha at once.

Trusted for billion-dollar supply chain and risk management decisions.









Four reasons Treefera delivers information advantage
Weekly, not 9-18 months from now
The production footprint refreshes annually via satellite and the Weather Stress Score updates every week. For the 9-18 months before MARD/GSO publishes, Treefera is not just earlier, it is the only district-level signal on Vietnam's coffee supply.
Validated against five years of out-of-sample data
Detected area tracks official MARD/GSO figures within 15% across the two most productive provinces, every year 2020-2024, using the same model with no retraining. Government figures are used to score accuracy after the fact, never as a model input.
Independent of government reporting
USDA FAS, FAOSTAT and most sources the market treats as independent all trace to the same MARD/GSO upstream figure. That convergence is not independent validation, it is one measurement through multiple channels. Treefera is independently derived from satellite and weather data, and continuous through the 9-18 month official reporting gap.
District level, production-weighted
A rainfall anomaly in a 61% coffee district is a supply signal. The same anomaly in a 7% coffee district is noise. The Weather Stress Score is weighted by confirmed coffee density across 52 districts, so localised stress registers immediately rather than weeks later in a national average.
Insights
Recent News
COMMODITIES INSIGHTS
15 July 2026
El Niño's Split Signal on Coffee: Why the Two Beans Move in Opposite Directions
As of mid-2026, arabica futures sit near 275¢ per pound against a Rabobank central target of 225¢, with market consensus at 74 million bags implying an 8.7 million bag surplus for the new Brazilian cr…
THOUGHT LEADERSHIP
6 May 2026
First-mile fertilizer exposure after the Strait of Hormuz closure: a read on the Gartner® research report
For supply chain operators and financial services firms with exposure to fertilizer-dependent commodity flows, first-mile signal supports earlier execution of the levers Gartner recommends.
FAQ
MARD/GSO publishes province-level coffee area annually, typically 9-18 months after the crop year closes - the 2024 yearbook landed in September 2025. USDA FAS and FAOSTAT trace back to the same figure. Treefera's district-level footprint tracks the same reality now, 9-18 months earlier.
Clear Data. Clear Decisions.
Walk through the model, five years of backtested results and the current 2026 signal - and assess whether it fits your workflow.
Request a demo