Coffee Brazil: See The Drought Before CONAB Cuts The Crop
Treefera's Brazil Coffee Production Area Forecast is a municipality-level map of standing coffee across Brazil's four producing states, paired with a weekly Weather Stress Score. It is built from satellite imagery and weather data, independent of government surveys and flags drought and frost pressure on the standing crop weeks to months before CONAB reports.
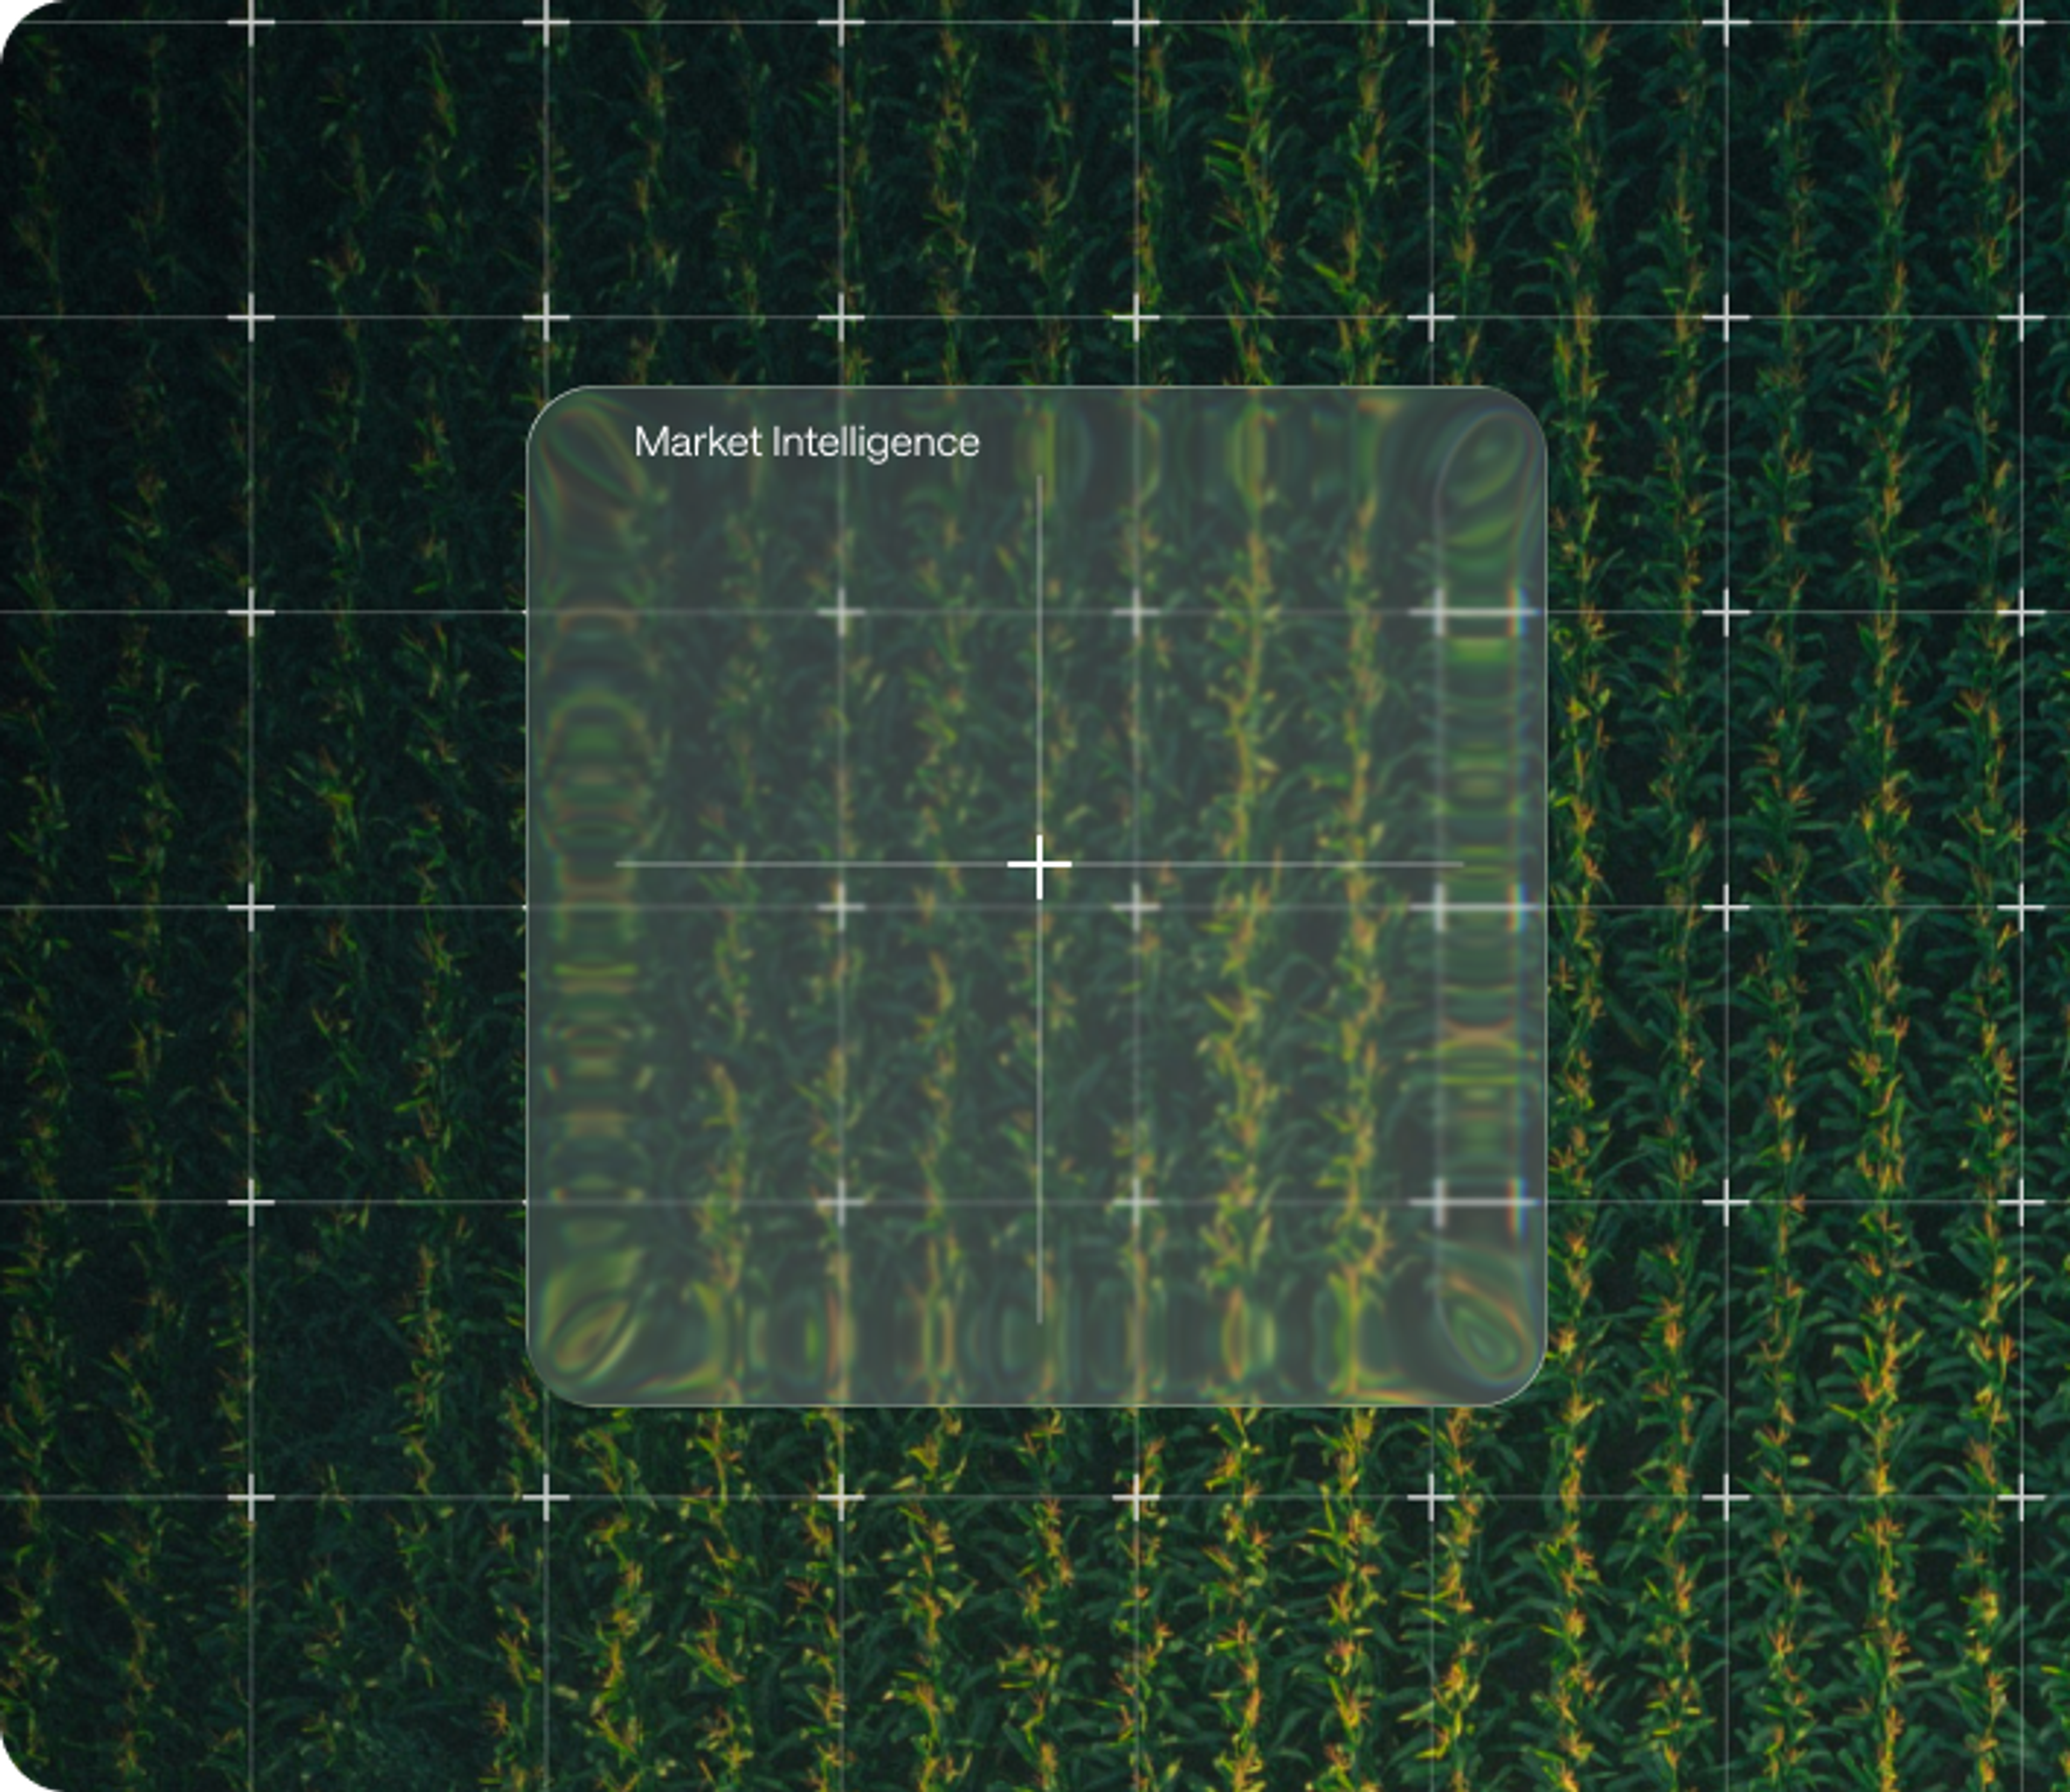

Brazil Coffee Production Area Forecast - 86% of 31 years of market-moving weather events captured, and the 2024 drought flagged months before CONAB cut its crop estimate
Brazil supplies roughly 40% of the world's coffee and sets the marginal price for arabica. Yet the official picture lags the field. CONAB surveys run 3-4 months behind in-season conditions, IBGE PAM lands a year after harvest, and the official area series disagree by tens of percent on the conilon states. There is no municipality-level signal until the crop is already picked.
Treefera reads the crop off the satellite. A municipality-level standing-coffee area baseline at 10-metre resolution across Minas Gerais, Sao Paulo, Bahia and Espirito Santo, paired with a weekly Weather Stress Score built from four independent hazard channels: arabica drought, conilon drought, pluvial and frost.
In 2024, the arabica drought channel crossed its stress threshold in May and kept climbing through the driest grain-fill window since 1981. CONAB did not lower its production estimate until November - 3-4 months after Treefera clients had been watching the signal build.
86%
of Brazil's market-moving weather events captured across 31 years, 18 of 21 from 1994 to 2025. 10 of 12 calm windows held below threshold
3-4
months ahead of CONAB. The 2024 grain-fill drought, the driest since 1981, showed clear stress in the signal from May 2024. CONAB did not lower its estimate until November.
1,894
municipalities of standing-coffee area at 10-metre resolution across the four states that carry ~93% of Brazil's coffee

In mid-May 2024, NY-C arabica was trading around $2.20 and the market was pricing a smooth crop. Treefera's arabica drought channel had already crossed its stress threshold and kept climbing.
The trailing twelve months delivering the crop had one dominant feature: the April to September 2024 grain-fill drought, the driest such window since 1981. The arabica drought channel for Minas Gerais and Sao Paulo crossed its p95 climatological threshold in May 2024 and peaked at 0.7-0.9 across the combined state envelope through grain fill - the strongest drought signal in the five-year series. CONAB did not lower its production estimate until November 2024. That is a 3-4 month lead on a move that repriced the market, and it is where the information advantage lives.
Frost is the counter-intuitive part. A single severe radiative-frost night can take out a year of arabica in hours, and the season average can look benign right up to the event. The 2021 black-frost analog repriced the front by +25.4% in a single week as loss estimates tripled from 2-3 million bags to 5.5-9 million bags in seven days. Treefera runs a dedicated frost channel from June to August, using a Camargo (1985) leaf-temperature proxy rather than a raw temperature reading - built to catch the sharp cold waves that a generic weather feed misses.
Trusted for billion-dollar supply chain and risk management decisions.







Four reasons Treefera delivers information advantage
Weeks to months ahead of CONAB
The Weather Stress Score updates weekly on the standing crop, while CONAB surveys lag field conditions by 3-4 months and IBGE PAM lands a year after harvest. When official reporting has no in-season signal, Treefera clients do.
Validated across 31 years of real events
The stress score is scored against a catalogue of 21 named market-moving weather events from 1994 to 2025, capturing 86% - 18 of 21 - plus 30 of 36 finer-grain state-event tests. 10 of 12 calm windows held below threshold. The two misses are published, not hidden. CONAB is the timing benchmark, never a model input.
Independent of government reporting
Treefera reads the crop directly from satellite and weather data, independent of government surveys. It is not a repackaging of CONAB, IBGE PAM or USDA FAS, which all trace to the same contested upstream reporting chain - Cecafe has documented a ~103M-bag deficit in the official balance over 2000-2020. When the official numbers disagree, Treefera gives you a separate read.
Municipality grain, production-weighted
Coverage runs to the municipality level across the four states, so stress in Minas Gerais - ~70% of the belt - is never diluted by calm conditions elsewhere. Drought and frost are tracked as separate signals, so a June frost spike shows on its own rather than being averaged away. Localised stress registers immediately, not weeks later in a national average.
Insights
Recent News
COMMODITIES INSIGHTS
15 July 2026
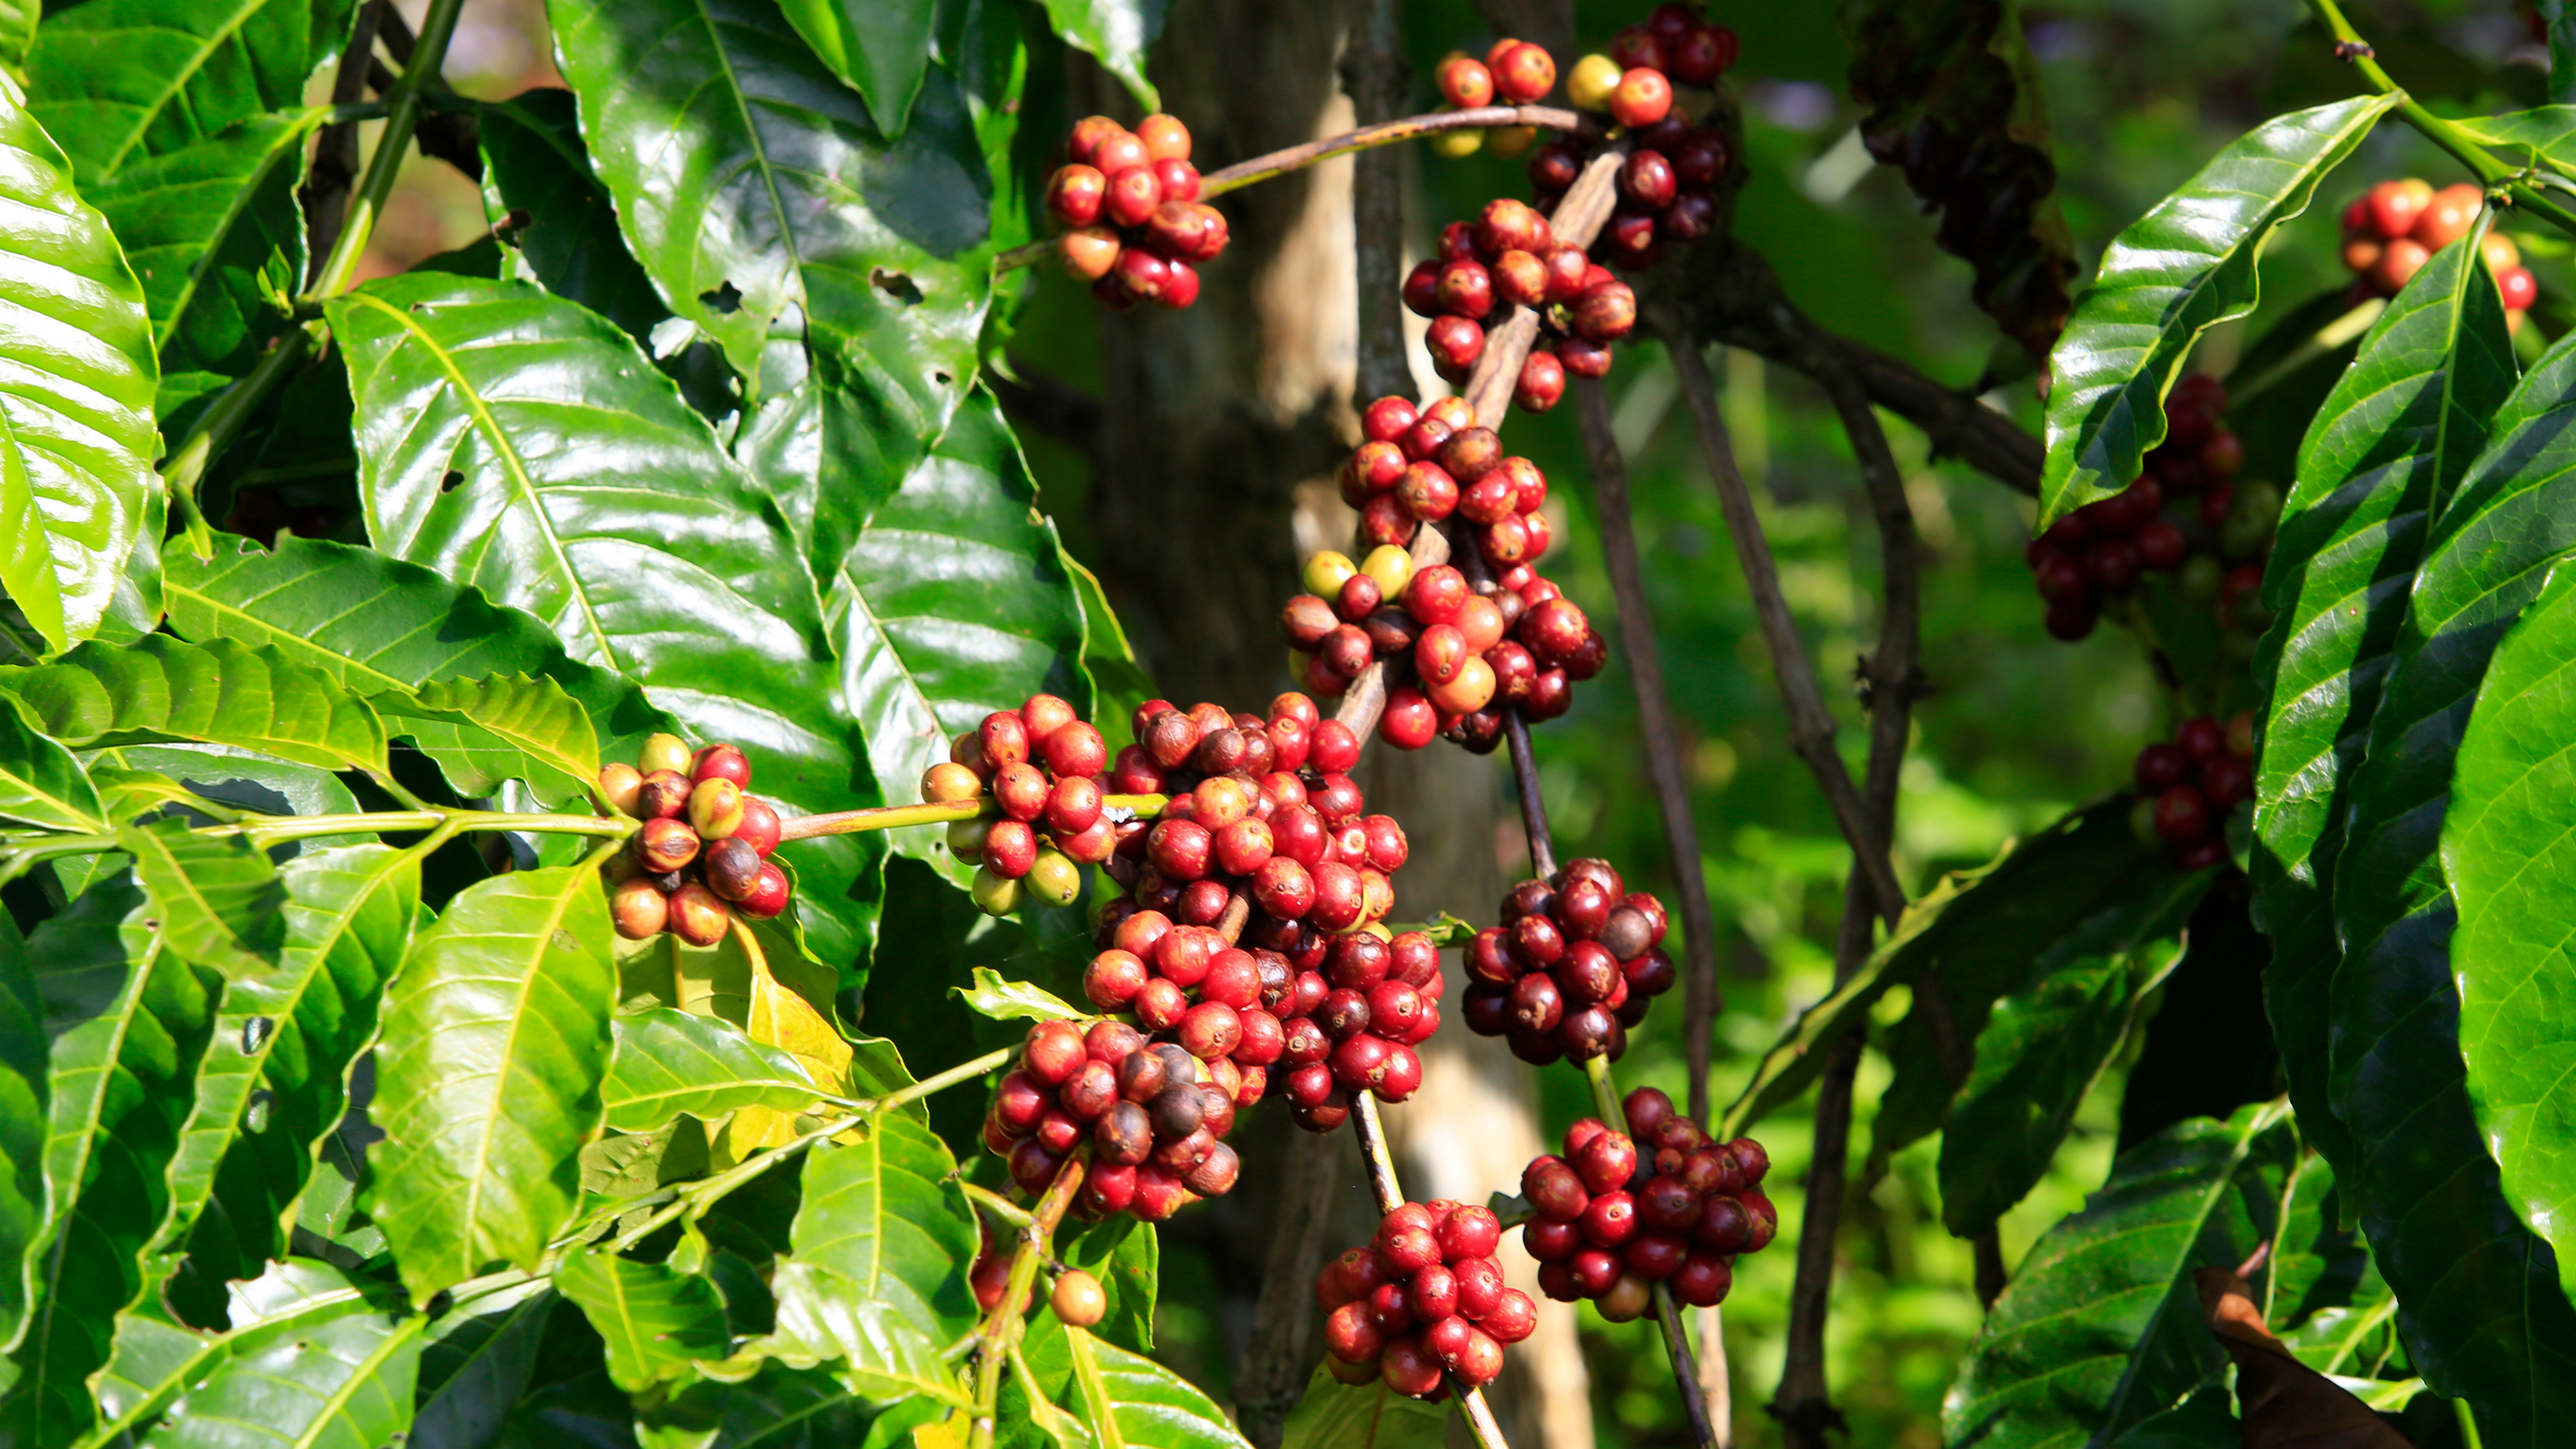
El Niño's Split Signal on Coffee: Why the Two Beans Move in Opposite Directions
As of mid-2026, arabica futures sit near 275¢ per pound against a Rabobank central target of 225¢, with market consensus at 74 million bags implying an 8.7 million bag surplus for the new Brazilian cr…
THOUGHT LEADERSHIP
6 May 2026
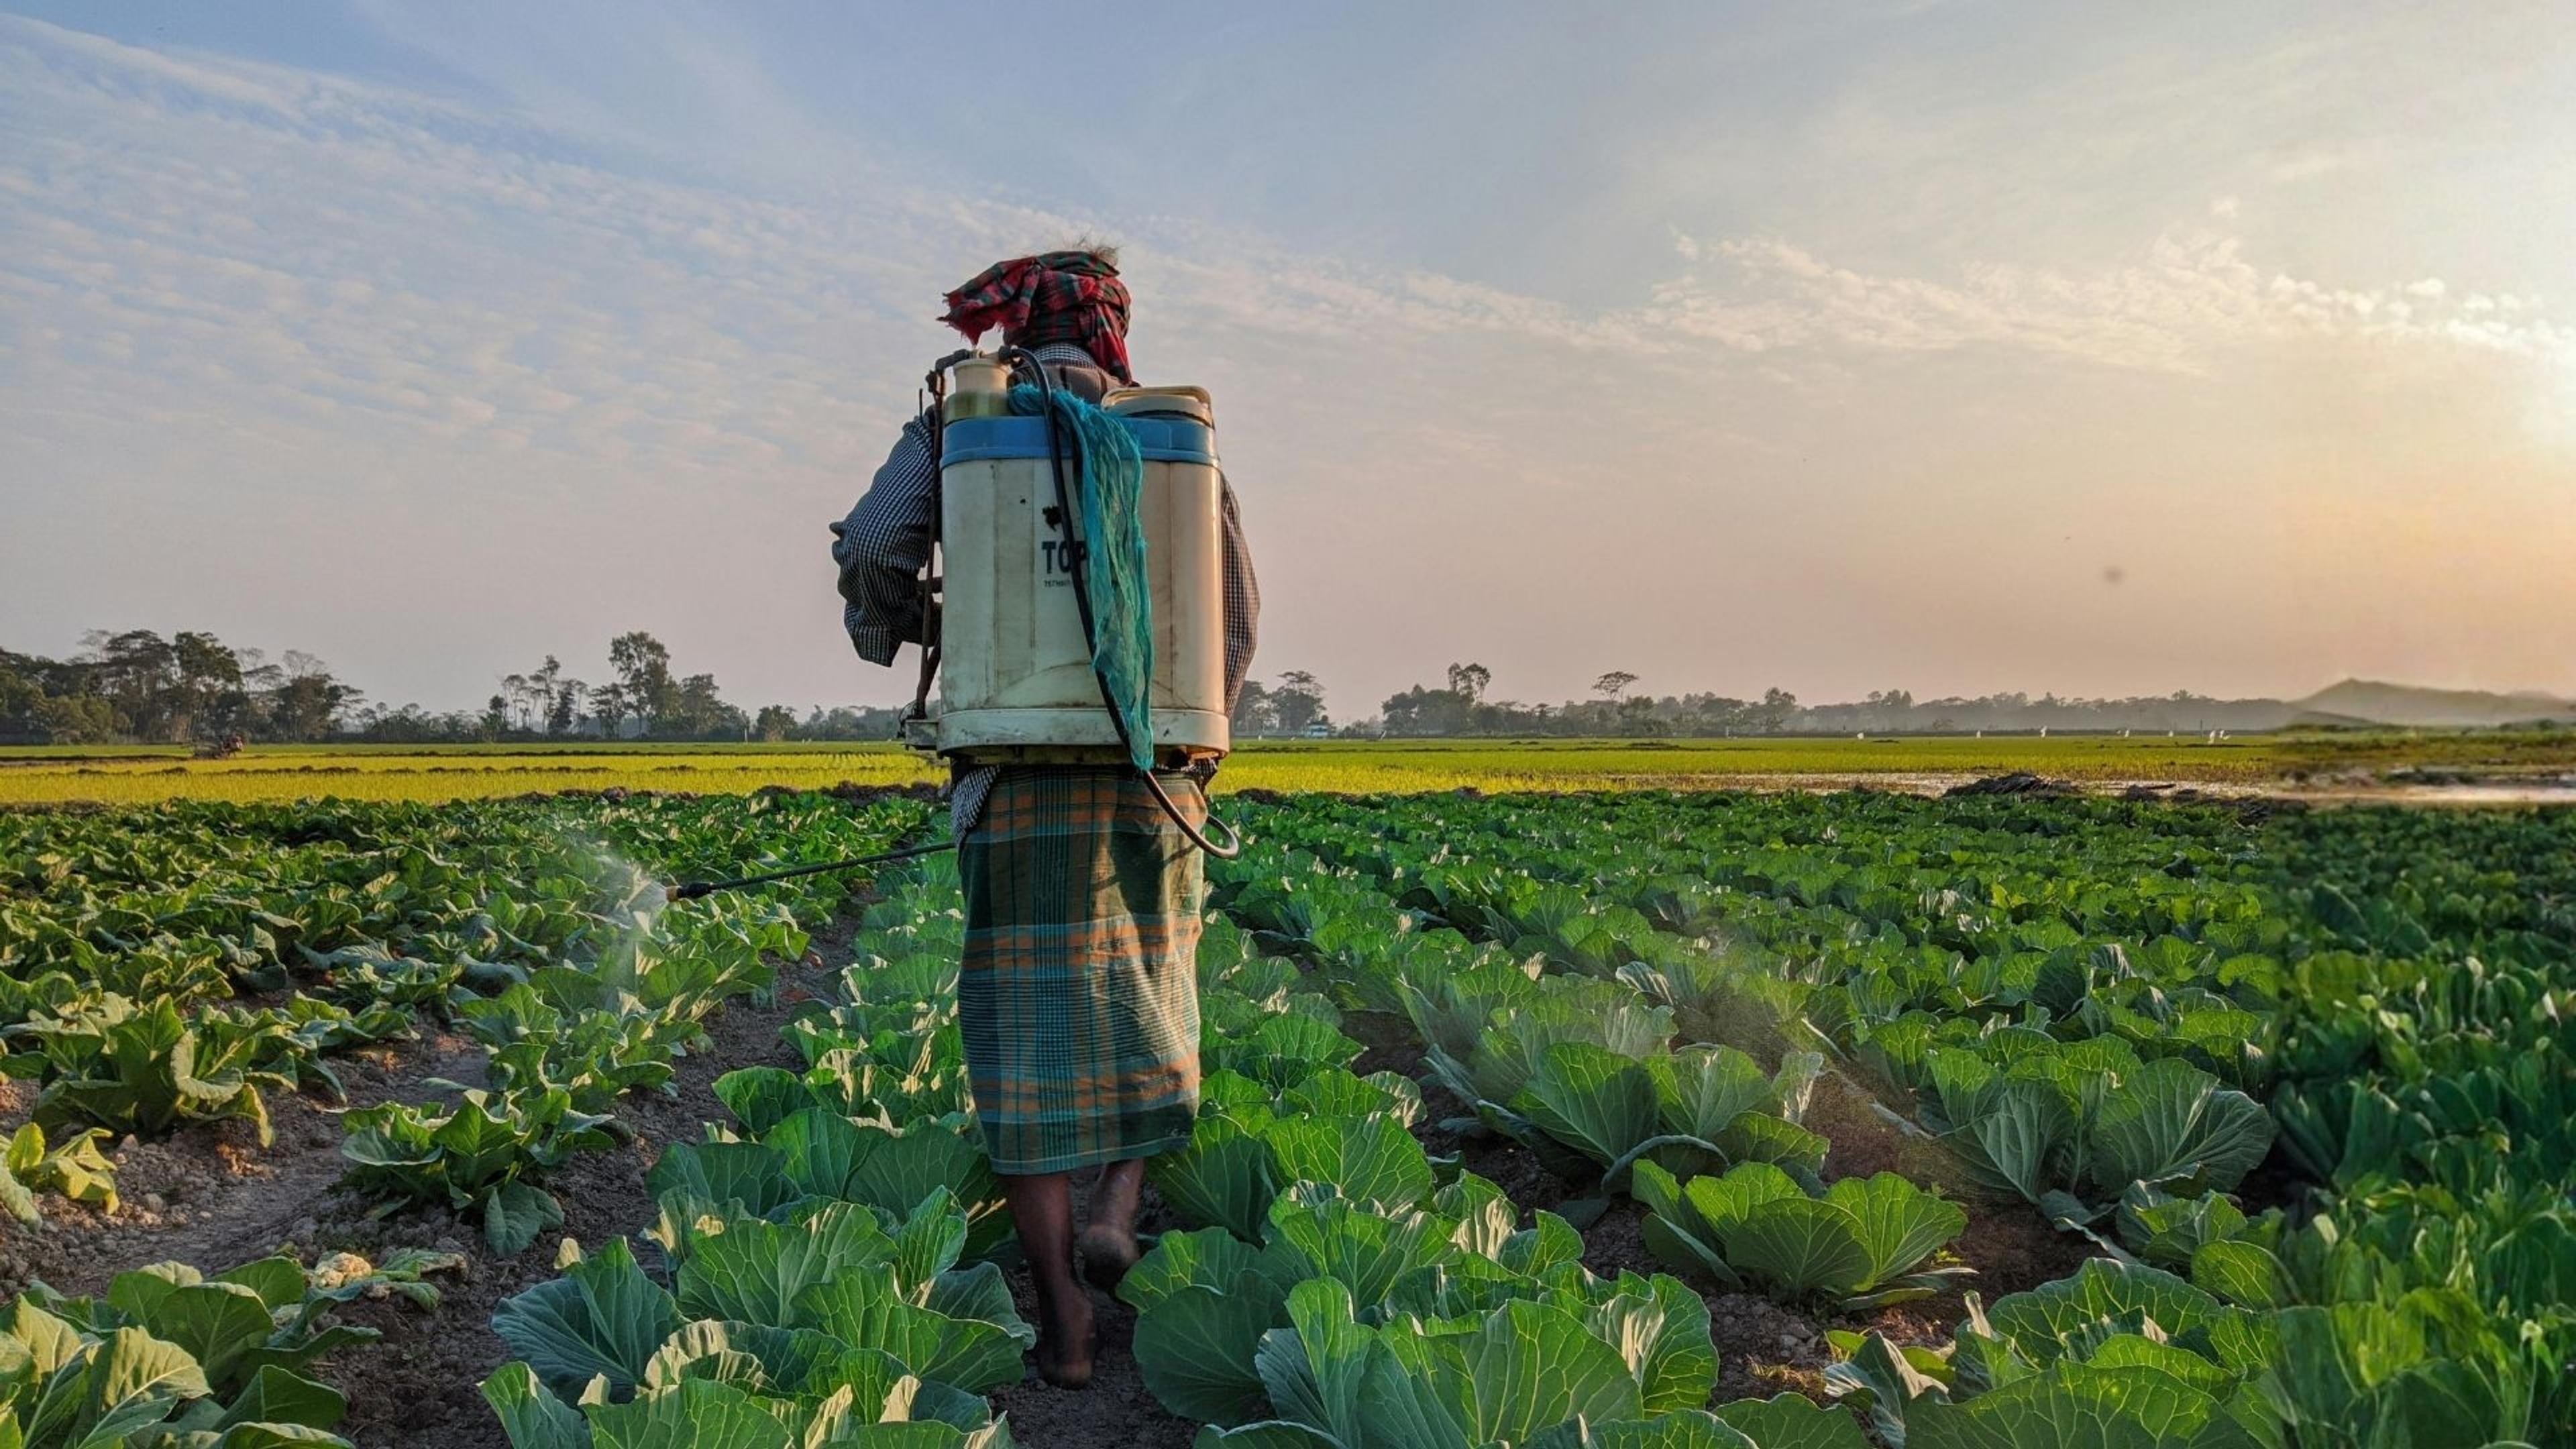
First-mile fertilizer exposure after the Strait of Hormuz closure: a read on the Gartner® research report
For supply chain operators and financial services firms with exposure to fertilizer-dependent commodity flows, first-mile signal supports earlier execution of the levers Gartner recommends.
FAQ
CONAB publishes crop estimates monthly, but its field surveys lag in-season conditions by 3-4 months, and IBGE PAM's definitive area figures arrive about a year after harvest. Treefera's Weather Stress Score updates weekly on the standing crop, and the annual area baseline ships each year - months ahead of the official picture.
Clear Data. Clear Decisions.
Walk through the model, five years of backtested results and the current 2026 signal - and assess whether it fits your workflow.
Request a demo