Cocoa Ghana: Read The Harmattan On The World's Second-Largest Cocoa Crop
Treefera's Ghana cocoa production area forecast is a satellite-derived map of the country's actively producing cocoa across 176 districts in 10 regions at 10-metre resolution, refreshed annually and overlaid with a weekly Weather Stress Score on confirmed cocoa area. It reads supply risk months before COCOBOD and USDA FAS revise their figures.
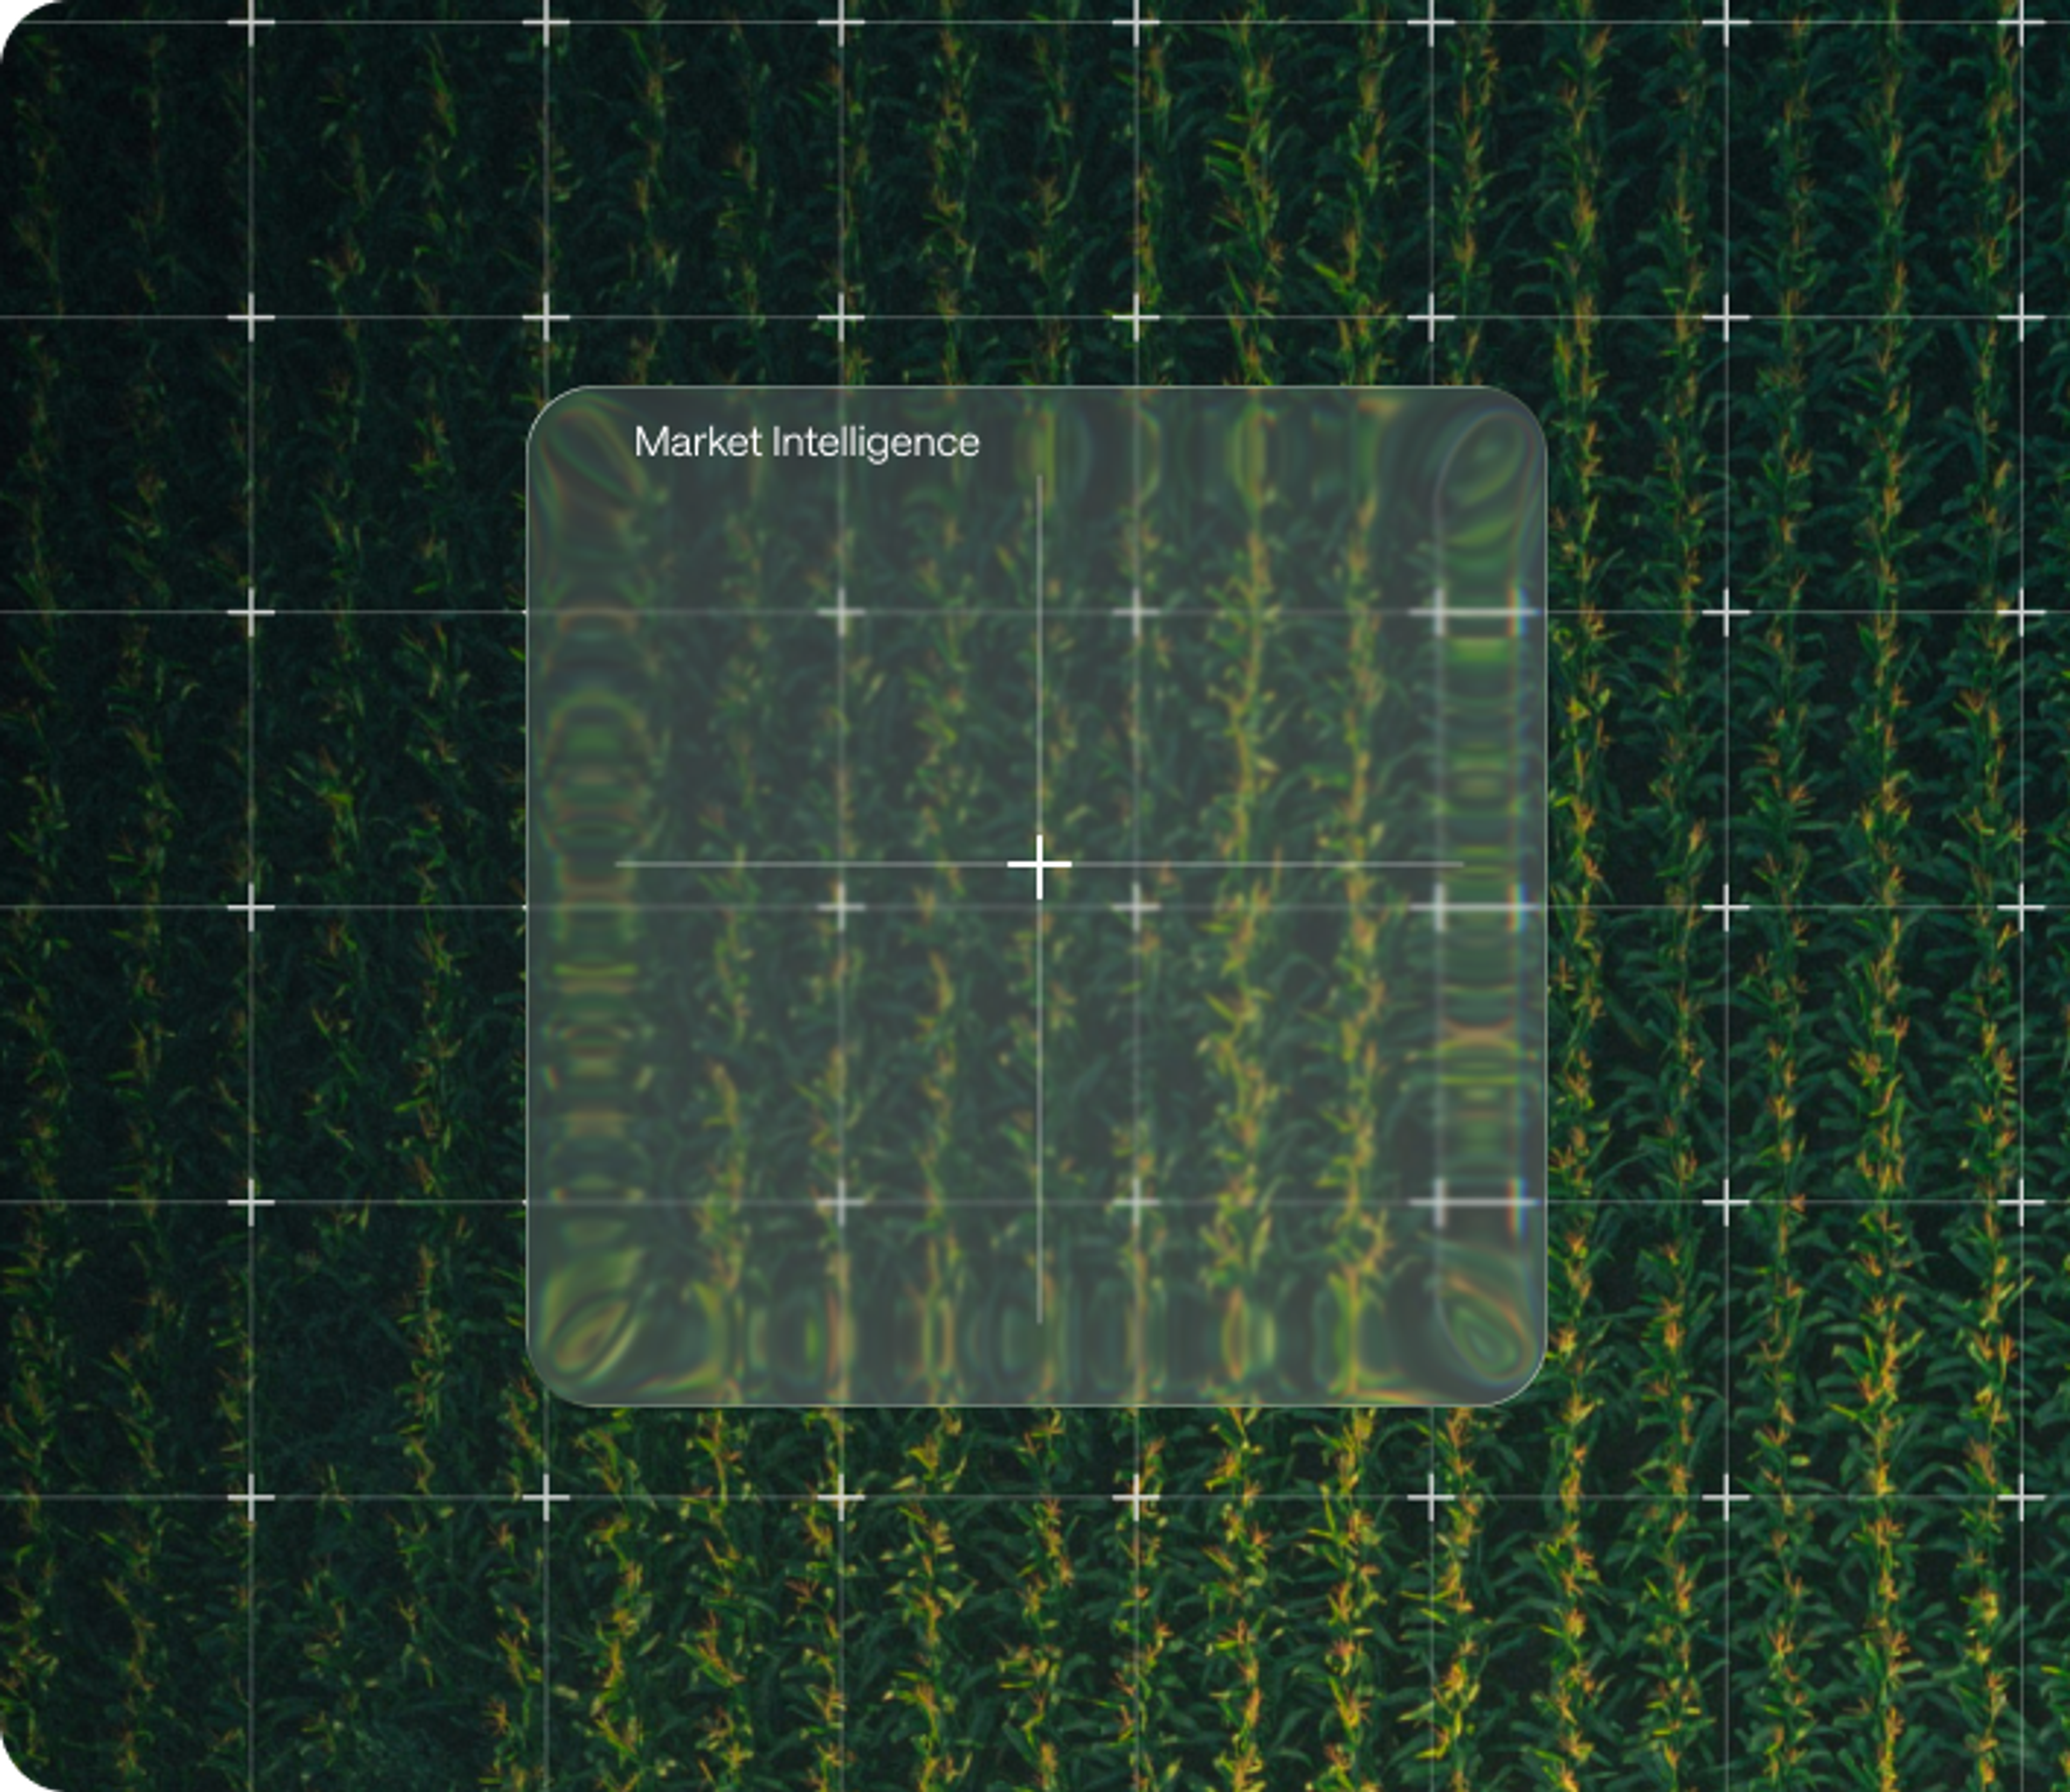

Ghana Cocoa Production Area Forecast - a supply signal that was more than 5 months ahead of COCOBOD's 25% forecast miss.
Ghana's cocoa supply risk is set in a handful of concentrated windows each season. COCOBOD, USDA FAS and ICCO all sit in the same reporting chain. By the time they converge on what happened, the Harmattan has closed and price discovery is complete.
Treefera maps Ghana's actively producing cocoa footprint across 176 districts at 10-metre resolution, refreshed annually, with a weekly Weather Stress Score applied to confirmed cocoa area. Not what happened to a region - what is happening to the cocoa inside it, week by week.
In early 2025, when COCOBOD was still projecting an 800,000 MT recovery, Treefera's Stress Score had already crossed above the level that closed the worst season in over a decade - more than 5 months before COCOBOD revised its forecast down by roughly 25%. That distinction is only possible with a verified map of where the actively producing cocoa actually is
5+
months ahead before COCOBOD revised its 800,000 MT forecast down by 25%
84.7%
site precision against 14,192 independent CERSGIS field sites, trained on Cote d'Ivoire and validated blind on Ghana with zero geographic overlap
0 retrains
five years of validated maps (2020-2024), same model, through El Nino drought, record Harmattans and recovery seasons

In early 2025, the market accepted a recovery narrative. Treefera's data showed which districts were already under severe stress.
COCOBOD opened 2024/25 targeting 800,000 MT, a recovery from 531,000 MT in 2023/24, the worst season in over a decade. By January 2025, 90 days into the Harmattan window, Treefera's belt-wide Stress Score stood at 0.76 - already above the 0.71 that closed the entire 2023/24 reference season, with months still to run. Ahafo 0.98. Ashanti 0.87. Western North 0.79. COCOBOD revised its forecast to approximately 600,000 MT in June 2025, a roughly 25% miss against its own opening target. A trader following the weekly Stress Score from November 2024 would have watched that signal build district by district, weeks before the market repriced the recovery.
Here is the part the belt-wide figure hides. Treefera's 2024 annual map confirmed a +11.7% expansion in actively producing area nationally. The regions driving that recovery - Ashanti +32.7%, Eastern +42.6%, Ahafo +15.9% - were the same regions registering near-maximum stress by January 2025. The recovery story and the stress story were pointing in opposite directions, in the same districts, at the same time. Only district-level data shows that.
Trusted for billion-dollar supply chain and risk management decisions.









Four reasons Treefera delivers information advantage
Weekly now, not months from now
Production area is refreshed annually from satellite. The Weather Stress Score updates every week across all 176 districts, through the Harmattan, the dry-season close and main-crop development. Supply risk is tracked continuously through the windows that decide the season - not captured once, after the fact, in a government survey.
Five years, one model, validated blind
Site precision of 84.7% against 14,192 independent CERSGIS field sites, trained on Cote d'Ivoire and evaluated on Ghana with zero geographic overlap. Same model, no retraining, 2020-2024. Official figures are used to check accuracy after the fact, never to train the model. This is a field-site diagnostic, not a wall-to-wall area claim.
Independent of government reporting
COCOBOD, USDA FAS and most sources the market treats as independent all trace to the same upstream reporting chain. That convergence is not independent validation - it is one measurement reported through several channels. Treefera is derived independently from satellite observation, a separate read of the same physical supply reality.
District level, production-weighted
A Harmattan anomaly in Atwima Mponua (Ashanti, 75,883 ha of confirmed active cocoa) is a supply signal. The same anomaly in a 5,000 ha district is noise. The Stress Score makes that distinction automatically, across 176 districts, every week. When a Harmattan hits Ashanti the supply implications vary district by district - regional averages cannot show that, and localised stress registers immediately rather than weeks later in a national average.
Insights
Recent News
COMMODITIES INSIGHTS
15 July 2026
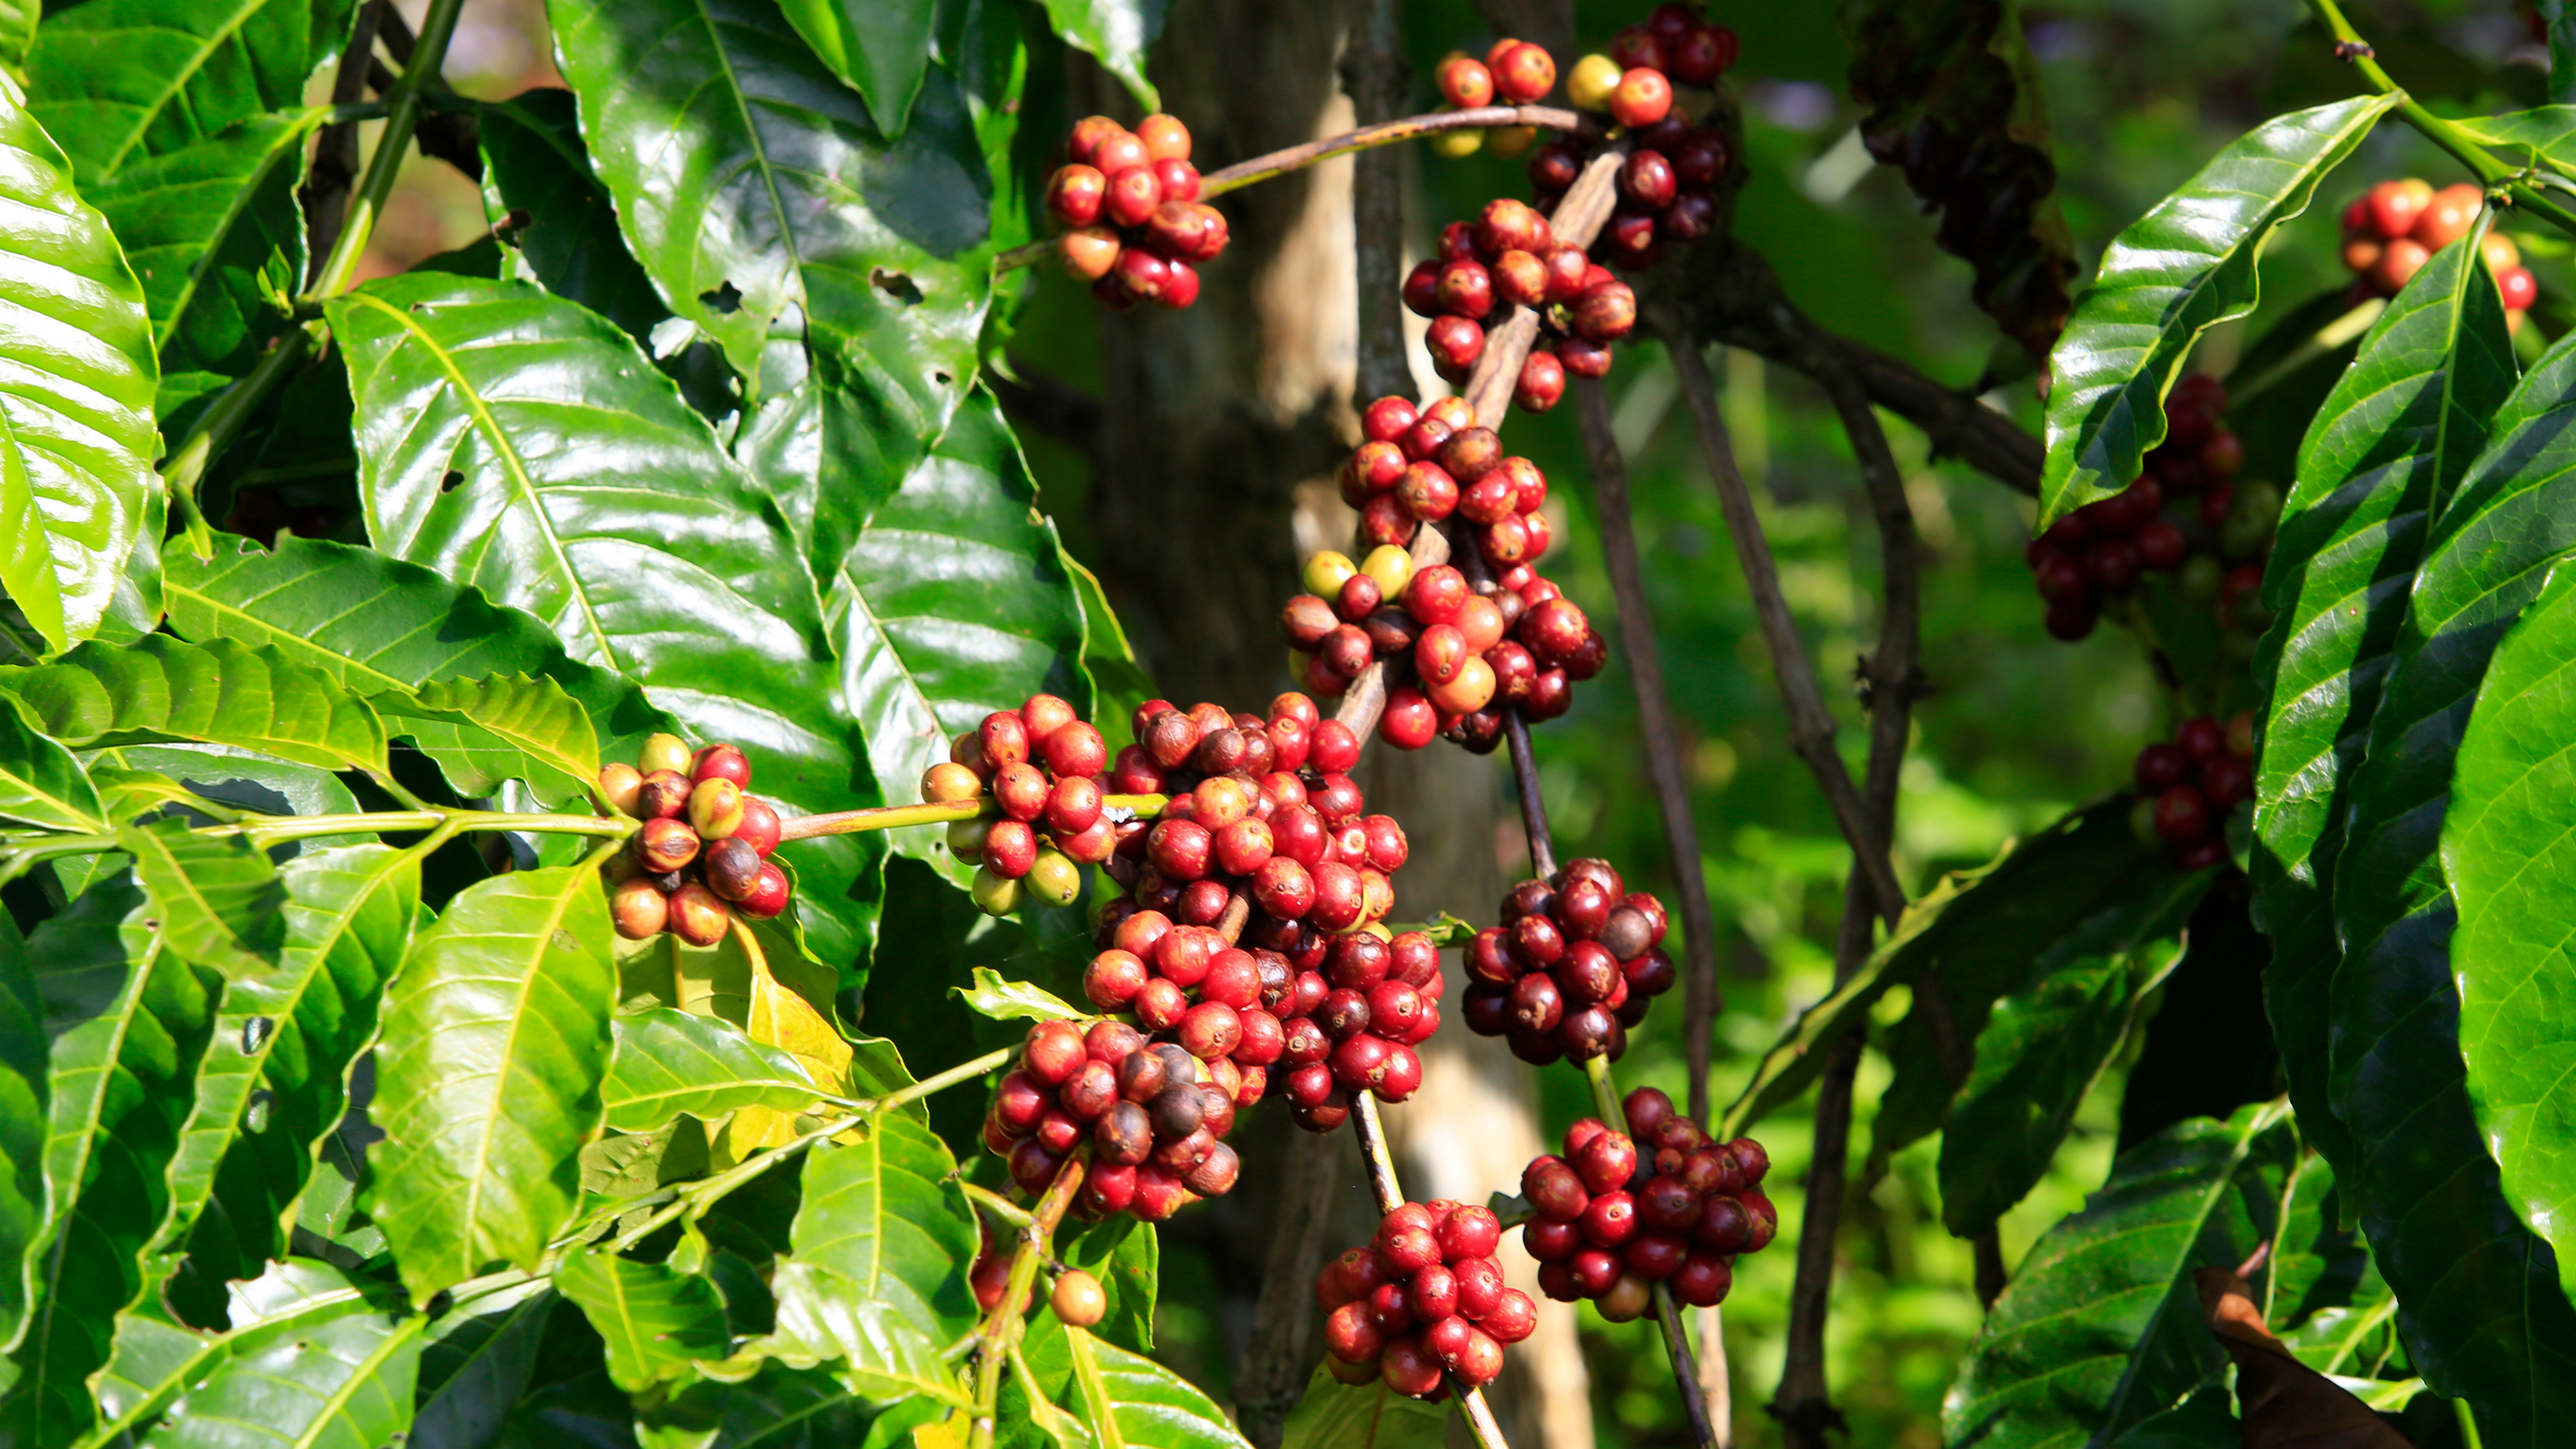
El Niño's Split Signal on Coffee: Why the Two Beans Move in Opposite Directions
As of mid-2026, arabica futures sit near 275¢ per pound against a Rabobank central target of 225¢, with market consensus at 74 million bags implying an 8.7 million bag surplus for the new Brazilian cr…
THOUGHT LEADERSHIP
6 May 2026
First-mile fertilizer exposure after the Strait of Hormuz closure: a read on the Gartner® research report
For supply chain operators and financial services firms with exposure to fertilizer-dependent commodity flows, first-mile signal supports earlier execution of the levers Gartner recommends.
FAQ
COCOBOD publishes annual production and registered-area figures 9-12 months after the season ends, and USDA FAS and ICCO trace back to the same source. Treefera delivers a weekly Weather Stress Score on confirmed cocoa area throughout the season, plus an annually refreshed area map, so supply risk is visible while the season is still open.
Clear Data. Clear Decisions.
Walk through the model, five years of backtested results and the current 2026 signal - and assess whether it fits your workflow.
Request a demo