As of September 2026, continued monitoring has provided a clearer view of both US crops. Southern Plains winter wheat conditions deteriorated further after the severe moisture deficit identified in April, while rainfall reduced the sub-surface moisture pressure observed in corn at the same point in the season. The difference is consistent with the timing of ENSO exposure. Its atmospheric effects in the Northern Hemisphere peak from November through January and decline by spring. Winter wheat develops across that period, while corn reaches its critical pollination stage in July. ENSO exposure therefore remains relevant to wheat but has little direct bearing on US corn. In both cases, the September assessment extends the earlier analysis with observations collected as the season progressed.
Winter wheat
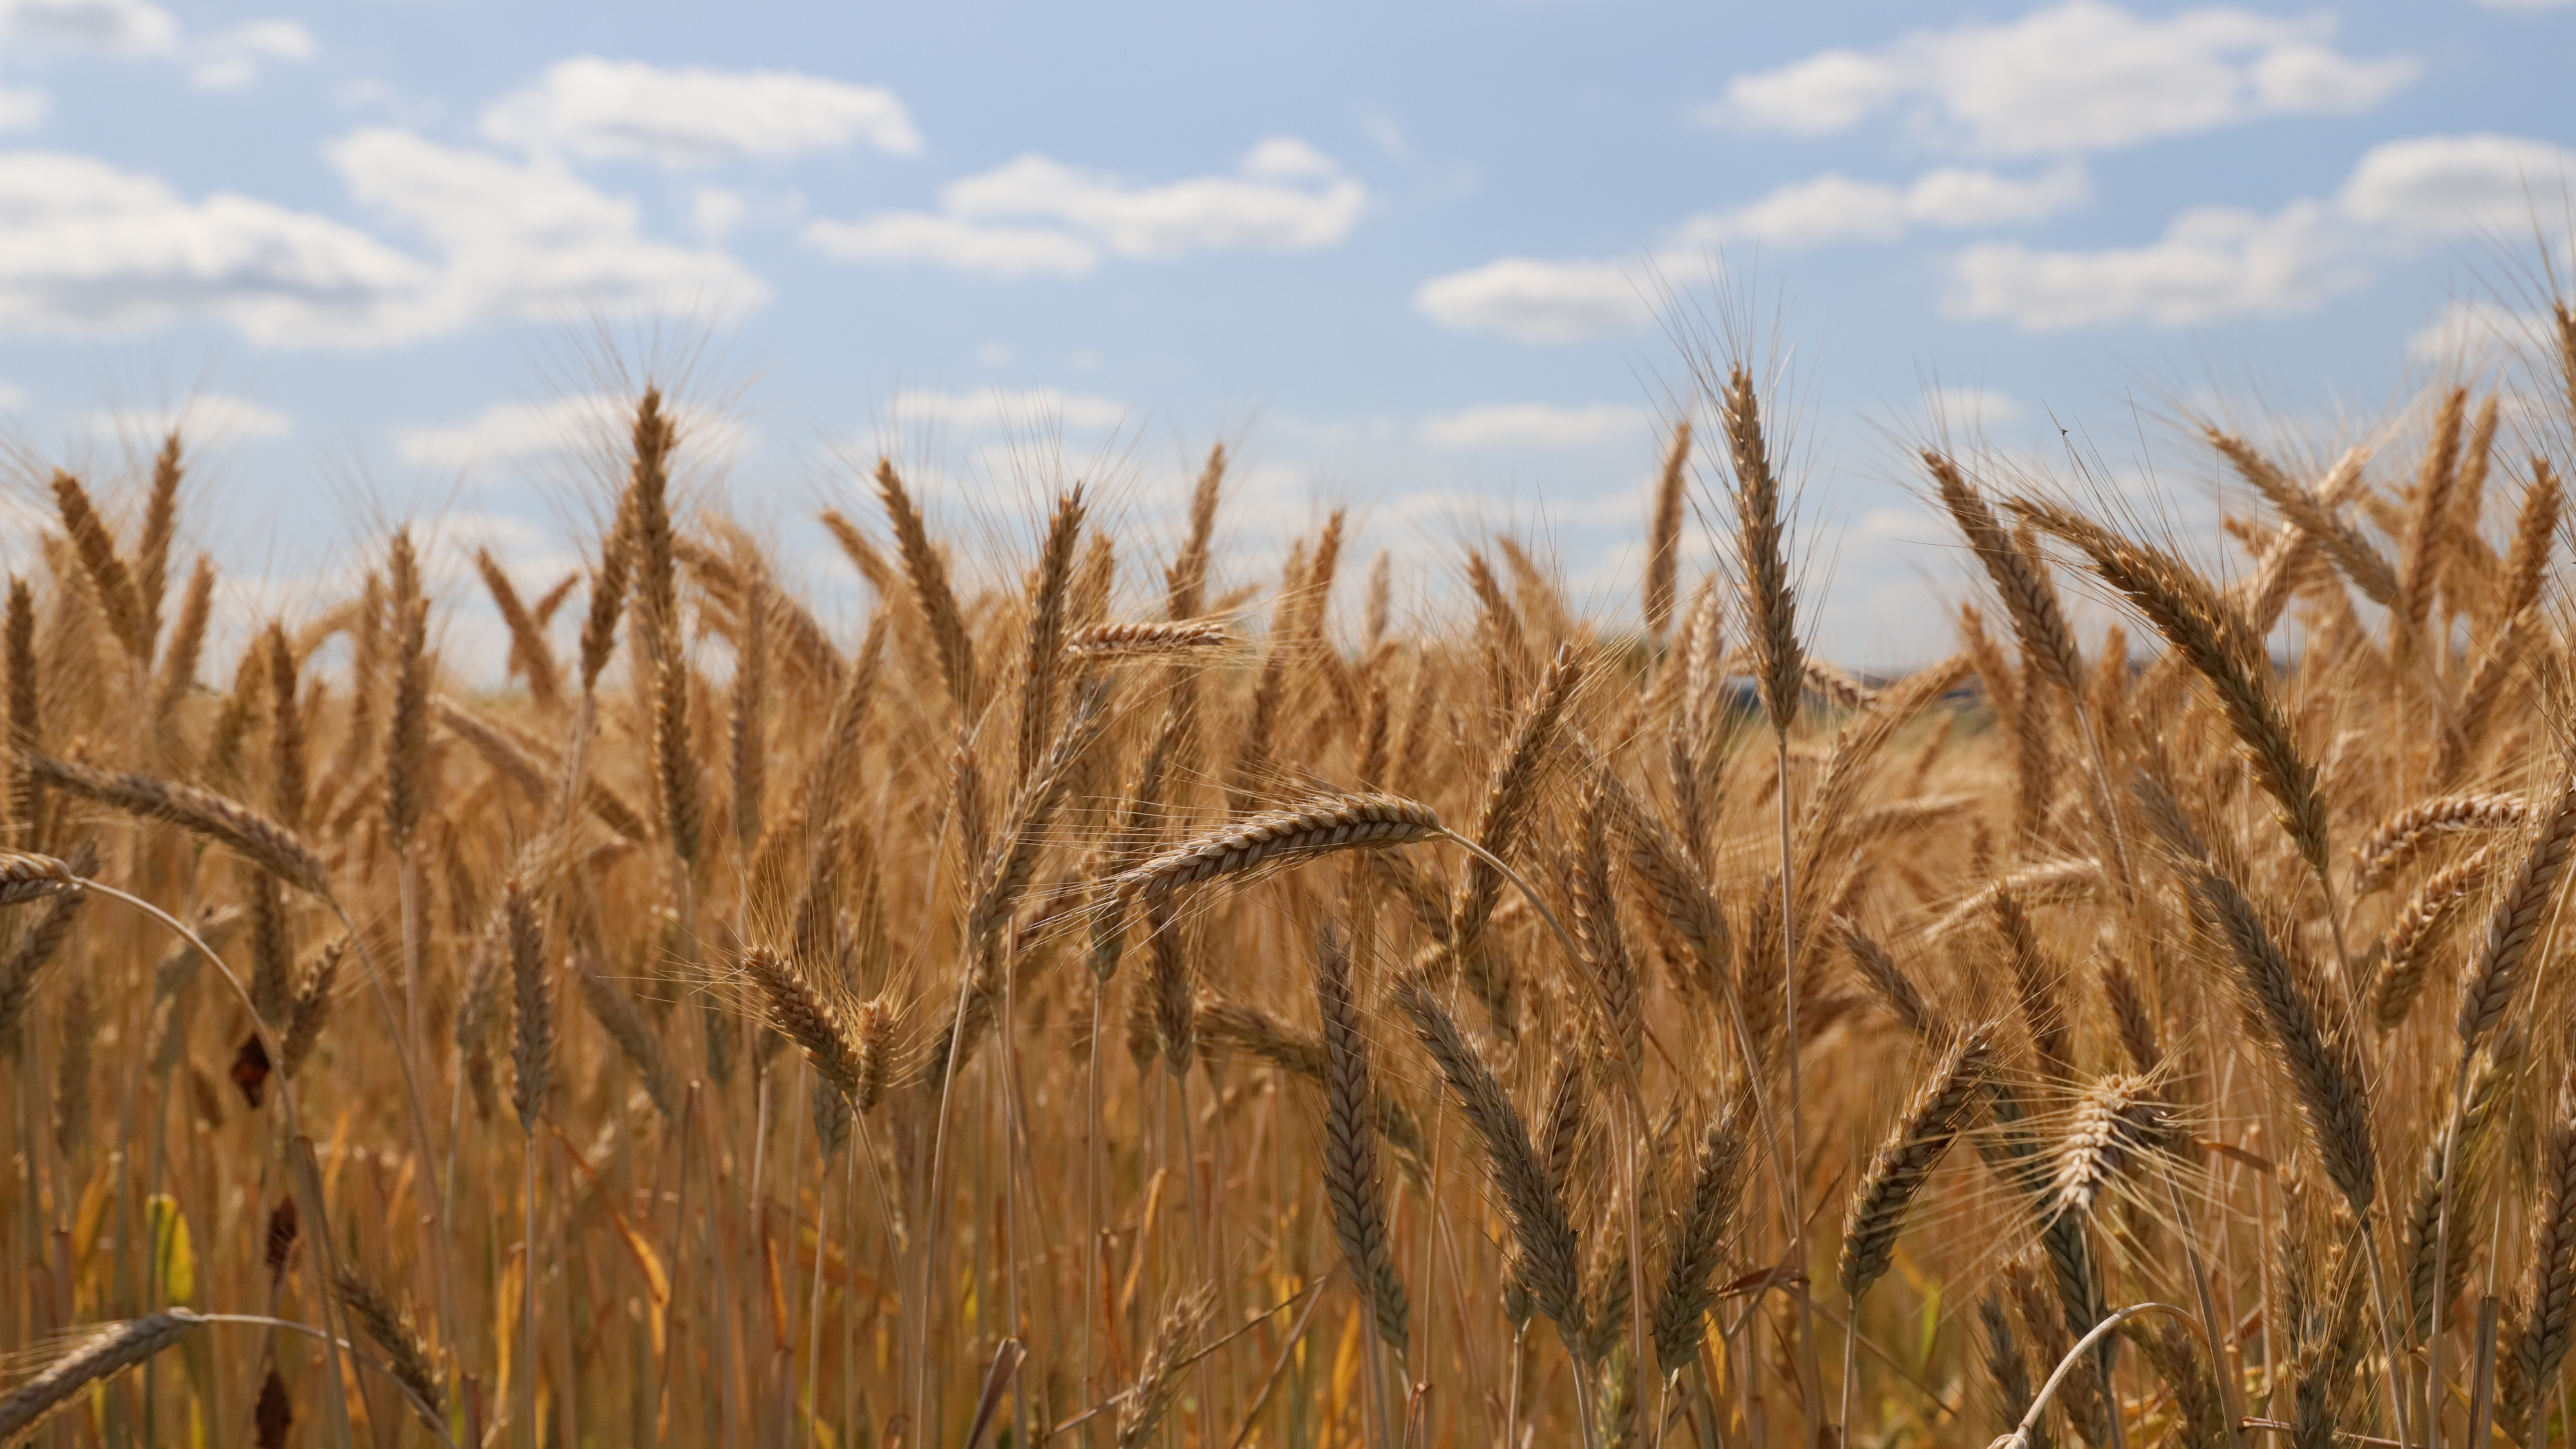
Southern Plains winter wheat (Texas, Oklahoma and Kansas) is sown in October and fills grain the following spring. Its entire growing season spans the November-January ENSO peak. El Niño tilts those winters wetter, recharging the soil moisture the crop draws on through spring, and the yield response is measurable: production in the three-state belt tracks the preceding-winter RONI at r = +0.52 (revised from the +0.54 we published in June, after recomputing directly against the underlying dataset), running roughly 18% above trend in El Niño years and 4% below trend in La Niña years.
The 2025-26 season developed under La Niña rather than the wetter conditions typically associated with El Niño. The hard red winter (HRW) belt entered spring 2026 with a precipitation deficit of 63.8 millimetres against the 45-year ERA5 baseline, the deepest spring deficit on record. All five HRW states were at the 0th percentile for 1980-2025. Treefera's Southern Plains stress trajectory reached 0.95 in April, also the highest recorded level. USDA NASS crop progress data showed winter wheat heading two to three weeks earlier than the five-year range, while the national good-or-excellent rating fell to 31% in May. Based on these indicators, Treefera's April yield forecast was 49.0 bushels per acre, compared with USDA's February trend baseline of 50.8. The May WASDE subsequently confirmed lower yield expectations.
By August, additional field and satellite observations showed that conditions had deteriorated further. Treefera's 14 August Market Insight places national winter wheat yield at 39.84 bu/ac, compared with USDA's August estimate of 47.05. This implies production of 925.5 million bushels, 64 million below USDA's August balance. Most of the difference is concentrated in hard red winter wheat, for which Treefera estimates stocks-to-use at 39.1%, compared with USDA's 49.4%. In mid-August, the KC HRW futures premium over CBOT SRW was approximately 69 cents, above its five-year mean of about 40 cents. The USDA Small Grains Annual Summary on 30 September will provide the next direct comparison.
Treefera's winter wheat estimate moved from 49.0 bu/ac in April to 39.84 in August as the effects of the record spring moisture deficit became clearer. USDA's benchmark moved from 50.8 to 47.05 over the same period. The August assessment builds on the risk identified in April using observations from the intervening months.
Corn
US corn has little direct exposure to ENSO because it is planted in May and reaches its most vulnerable stage, pollination, in mid-July, several months after El Niño's atmospheric effects have declined. Across Corn Belt data since 1950, growing-season stress shows no material difference by ENSO phase, and the detrended yield response is within one eighth of a standard deviation of zero. This is consistent with the absence of a direct mechanism. Several major corn-market events have nevertheless been associated incorrectly with El Niño. The 1988 drought occurred during La Niña, the 2012 drought reflected internal atmospheric variability, and the 2007 price change followed the ethanol mandate.
Corn remained exposed to risks unrelated to ENSO. In April, Treefera's Greenprint Weather Pipeline placed deep root-zone soil moisture, measured at 100-289 centimetres, at the 2nd percentile in Iowa, Illinois and Missouri. These states produce 43% of the US corn crop. Surface and shallow soil moisture in the same states remained between the 32nd and 57th percentiles, so the deficit was not yet visible in headline crop progress data. Phenology-weighted stress z-scores were -1.5 in Nebraska, -1.1 in Kansas, -0.8 in Missouri and -0.6 in Iowa. December futures traded near $4.75 per bushel, with implied volatility at a 15-year low. Treefera's assessment identified a material sub-surface moisture risk for which prevailing market pricing allowed little margin.
Subsequent rainfall and moderate temperatures reduced the sub-surface moisture risk before it constrained yield. Treefera's 19 August Market Insight estimates the 2026 US corn crop at 185.9 bu/ac, above USDA's estimate of 180.7. Iowa and Illinois accounted for 26.8% of modelled corn area and had the greatest exposure in the April sub-surface reading. They subsequently received 111% and 113% of normal growing-season rainfall, respectively, without material excess heat. Treefera's model incorporated these changing conditions through a positive weather adjustment in every state. The adjustment was approximately twice as large in the eastern Corn Belt, where most production is concentrated, as in the drier west. Maximum temperatures across the Corn Belt reached or exceeded 95°F on 2.8 days during the growing period, compared with a normal of 3.1 days. Six of the 12 states recorded no such days. December futures rose approximately 3% to 483.25 cents after USDA reduced its yield estimate in the 12 August WASDE, while Treefera's updated estimate remained above USDA's.
The April assessment was based on 2nd-percentile deep soil moisture in Iowa, Illinois and Missouri and identified a credible downside scenario if the deficit persisted into the critical growth period. By August, 78% of Iowa's crop was rated good or excellent, and both Iowa and Illinois had received above-normal rainfall. Treefera's updated yield estimate was 185.9 bu/ac, compared with USDA's 180.7. December futures increased from approximately $4.75 to $4.83 per bushel following USDA's yield reduction.
The April signal remained relevant as an early indicator of vulnerability. Continuous monitoring then showed that rainfall reached the states accounting for the largest share of planted area, reducing the likelihood that the initial deficit would constrain yield.
Assessment
Production & 2026-27 forecast · Southern Plains
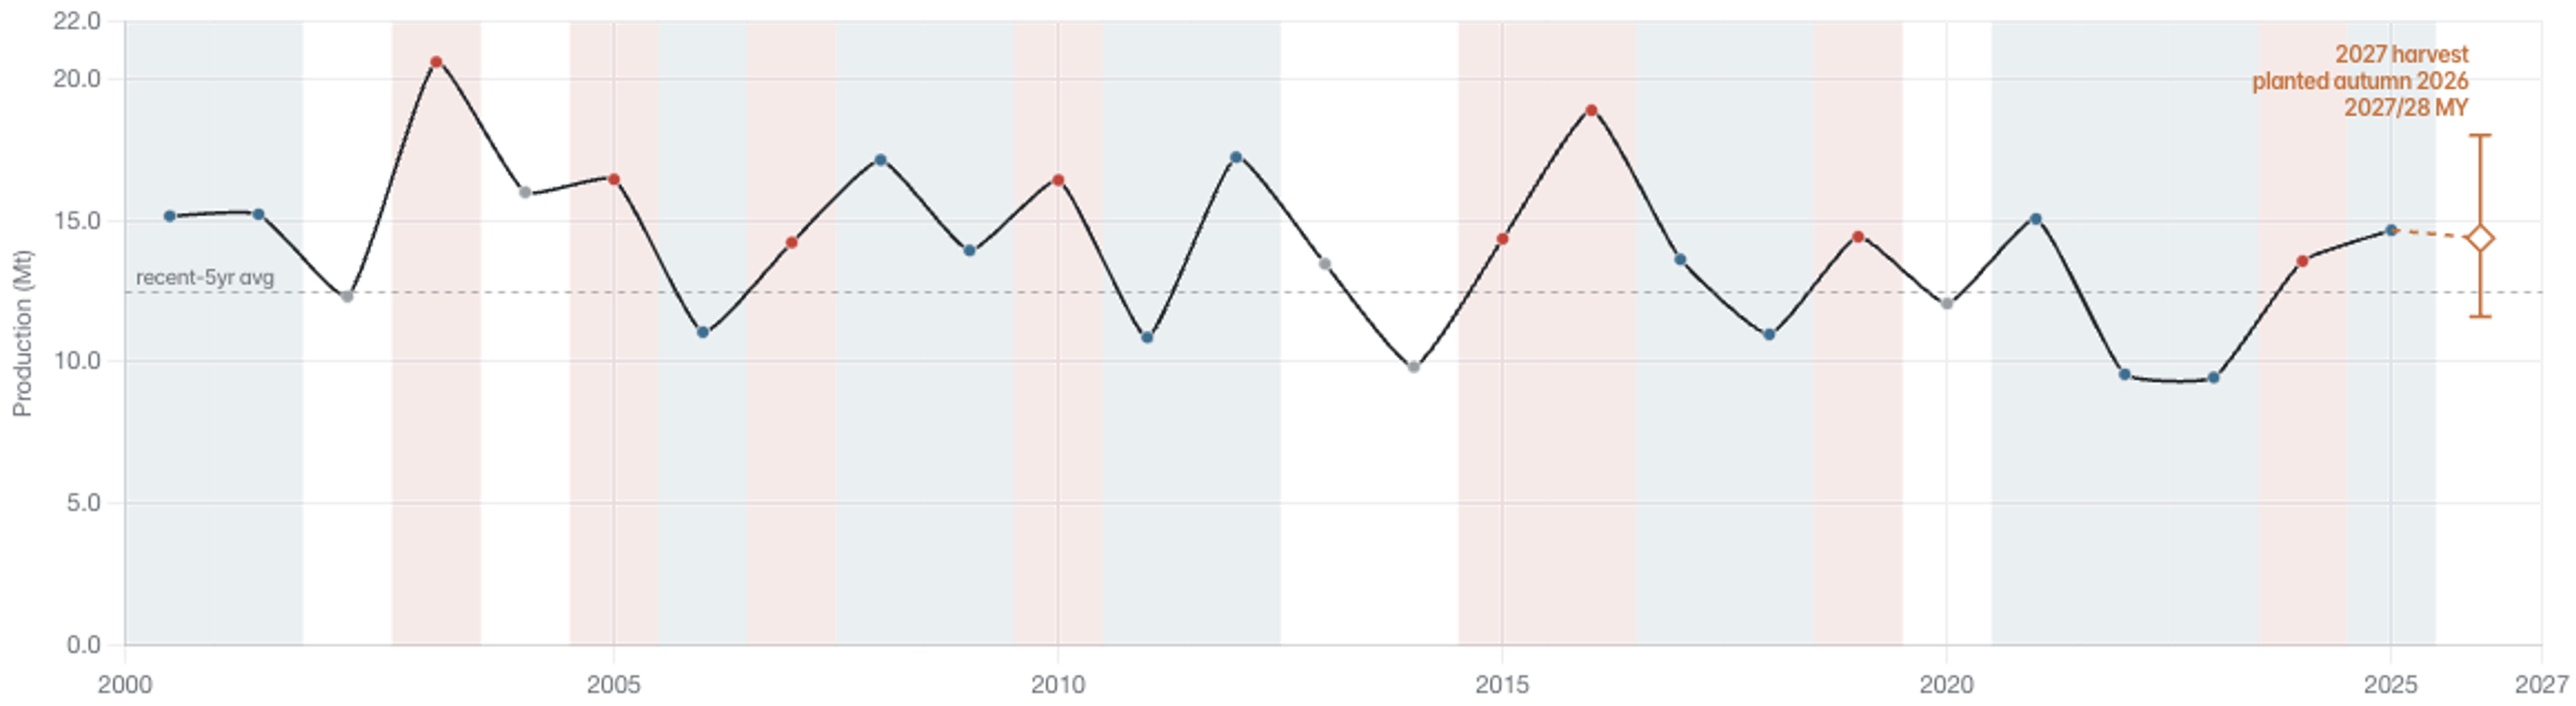
Source: USDA production · NOAA CPC ENSO phase · Treefera.
The timing distinction identified in June remains valid: winter wheat develops during the ENSO peak, while corn does not. It defines each crop's exposure to ENSO but does not determine the effect of other seasonal conditions. For wheat, observations collected after April showed the continuing effect of La Niña-related dryness through the remainder of the season. For corn, the April analysis separated the absence of a material ENSO relationship from an independently observed sub-surface moisture risk. Later rainfall and temperature data showed improving growing conditions in the states carrying the largest share of production. The September view for both crops is therefore a continuation of the earlier analysis, updated with conditions observed through the season.
Insights
Recent News