El Niño’s impacts on US Wheat and US Corn
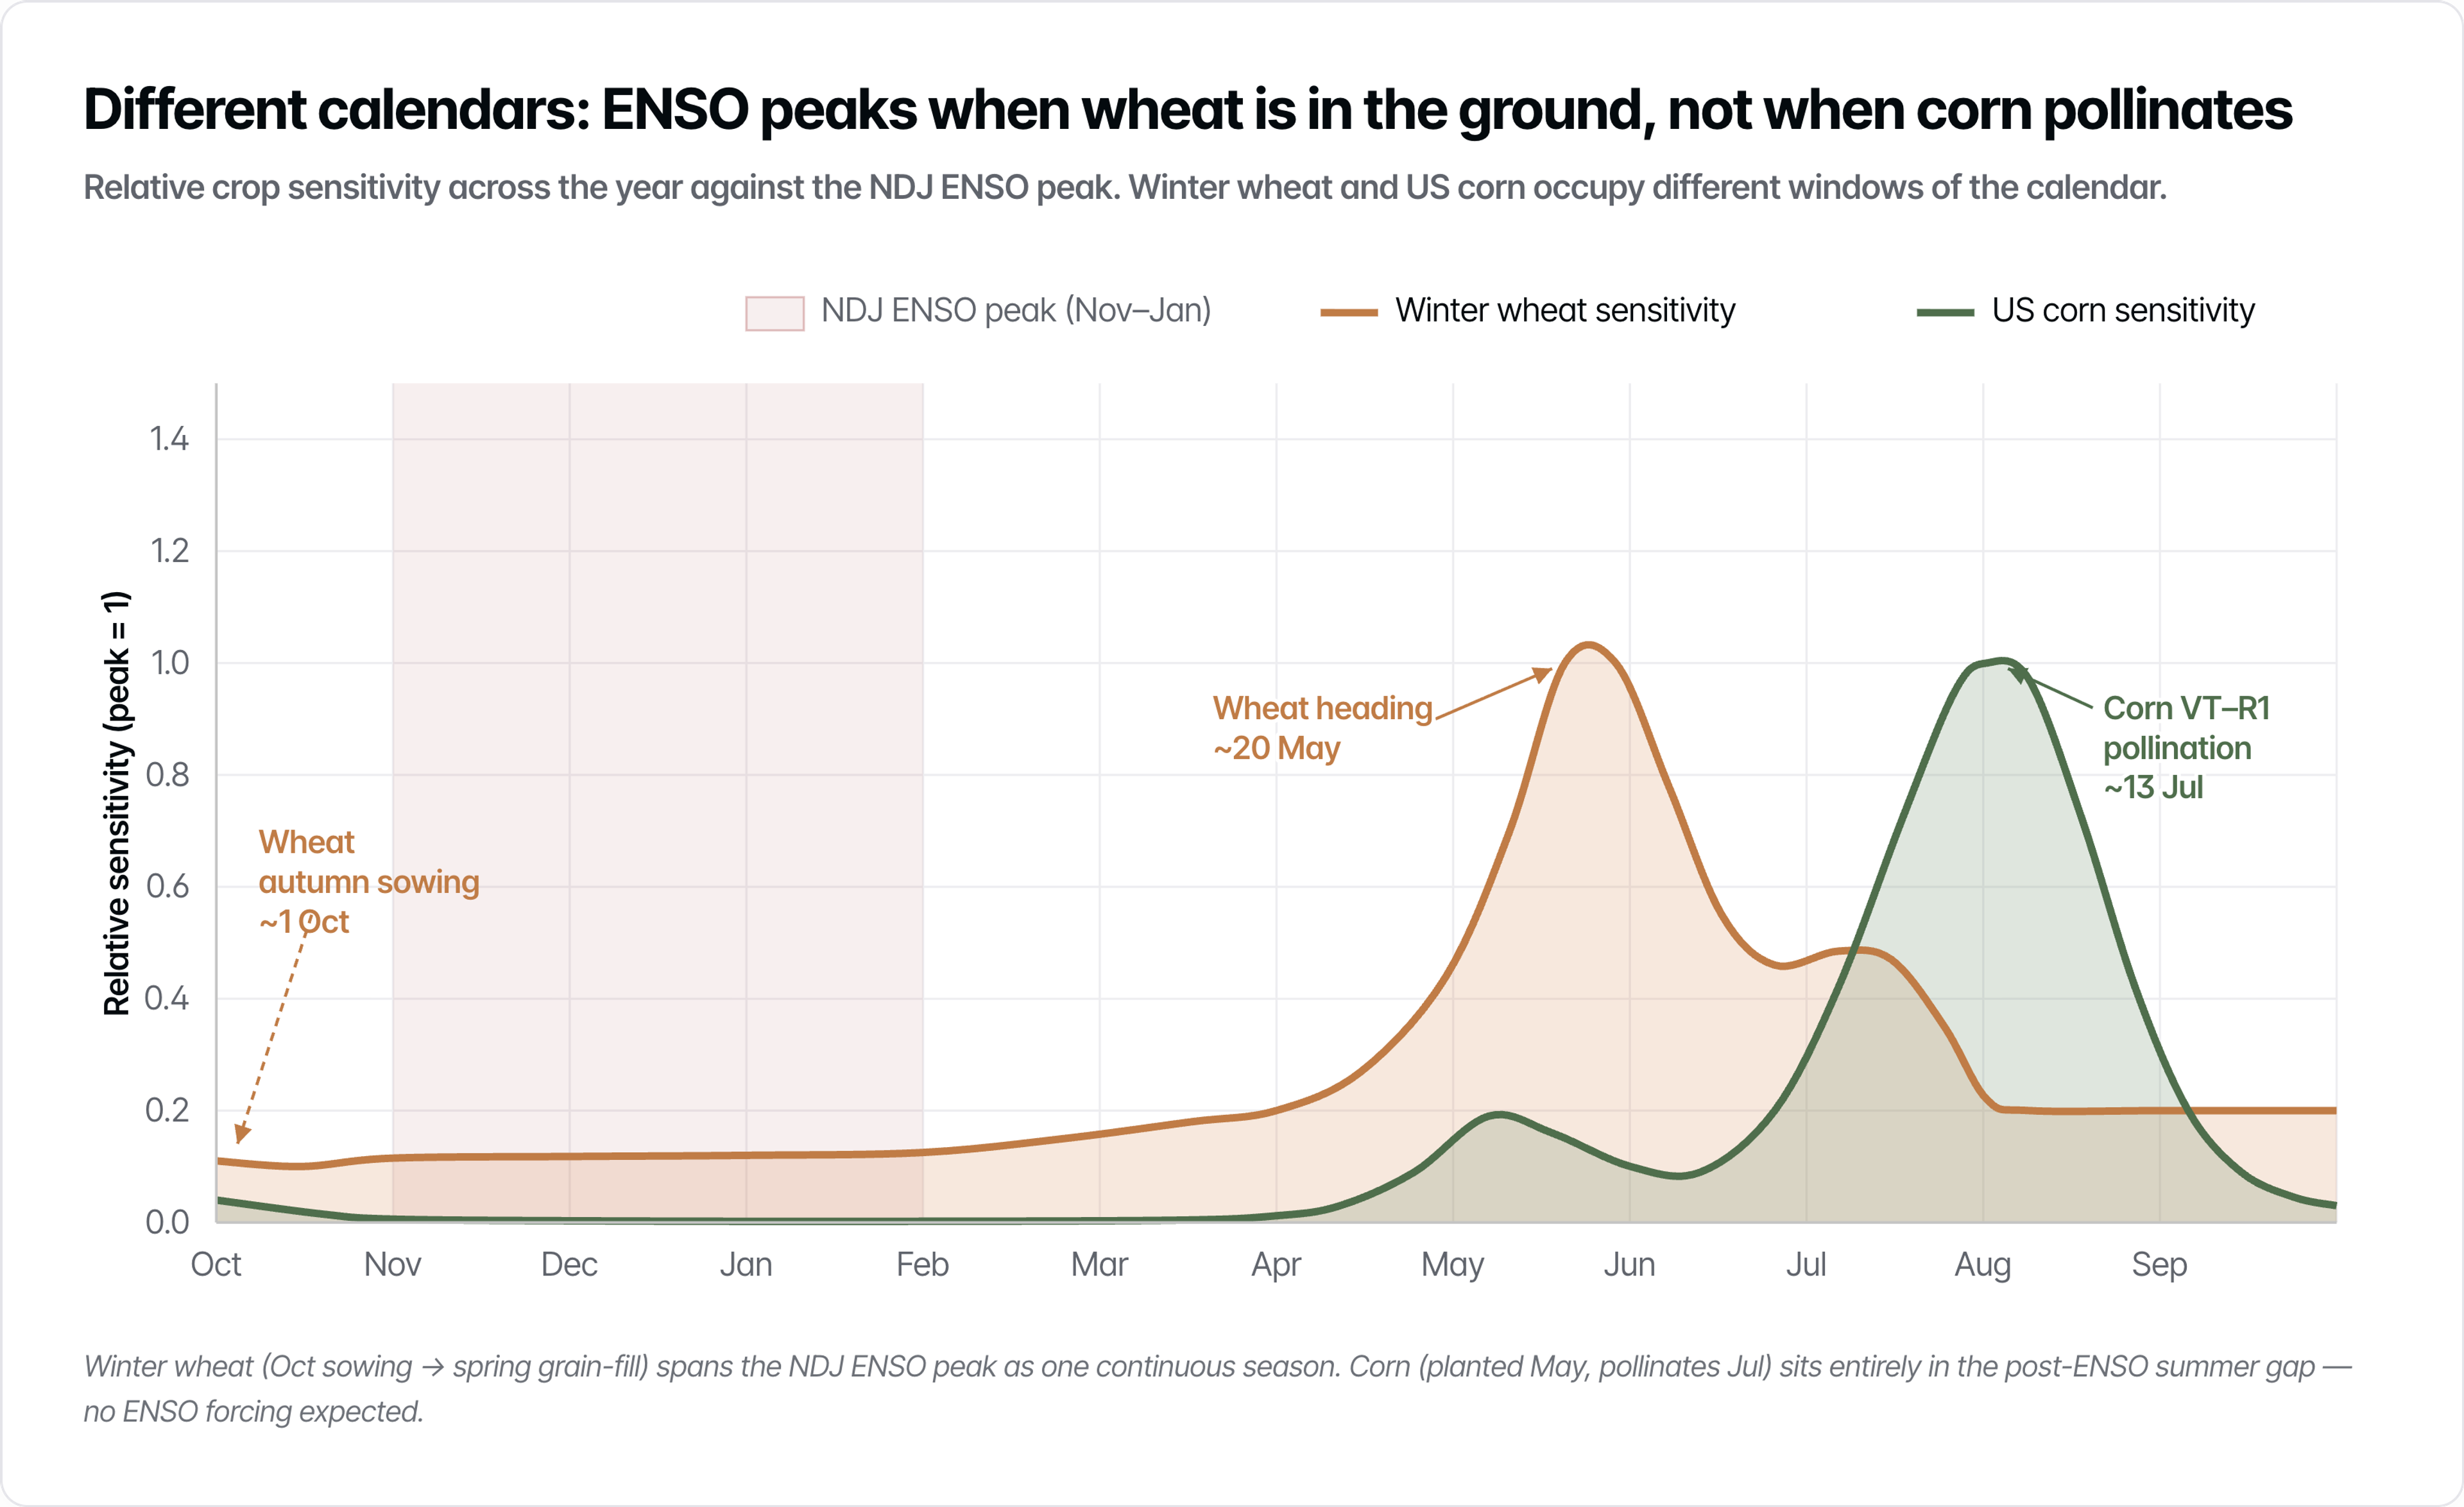
As of late spring 2026, December corn futures trade near $4.75 per bushel - implied volatility at a 15-year low - with the market pricing a benign summer. The hard red winter wheat belt has just emerged from its worst spring deficit in 45 years. Two crops, one El Niño event, opposite market signals - and the calendar explains the divergence entirely. ENSO is a Northern Hemisphere winter phenomenon. Its atmospheric consequences build through autumn, peak in November through January and decay by spring. Two of the United States' most traded grain crops fall on opposite sides of that calendar window and that calendar position determines their El Niño exposure.
Winter wheat
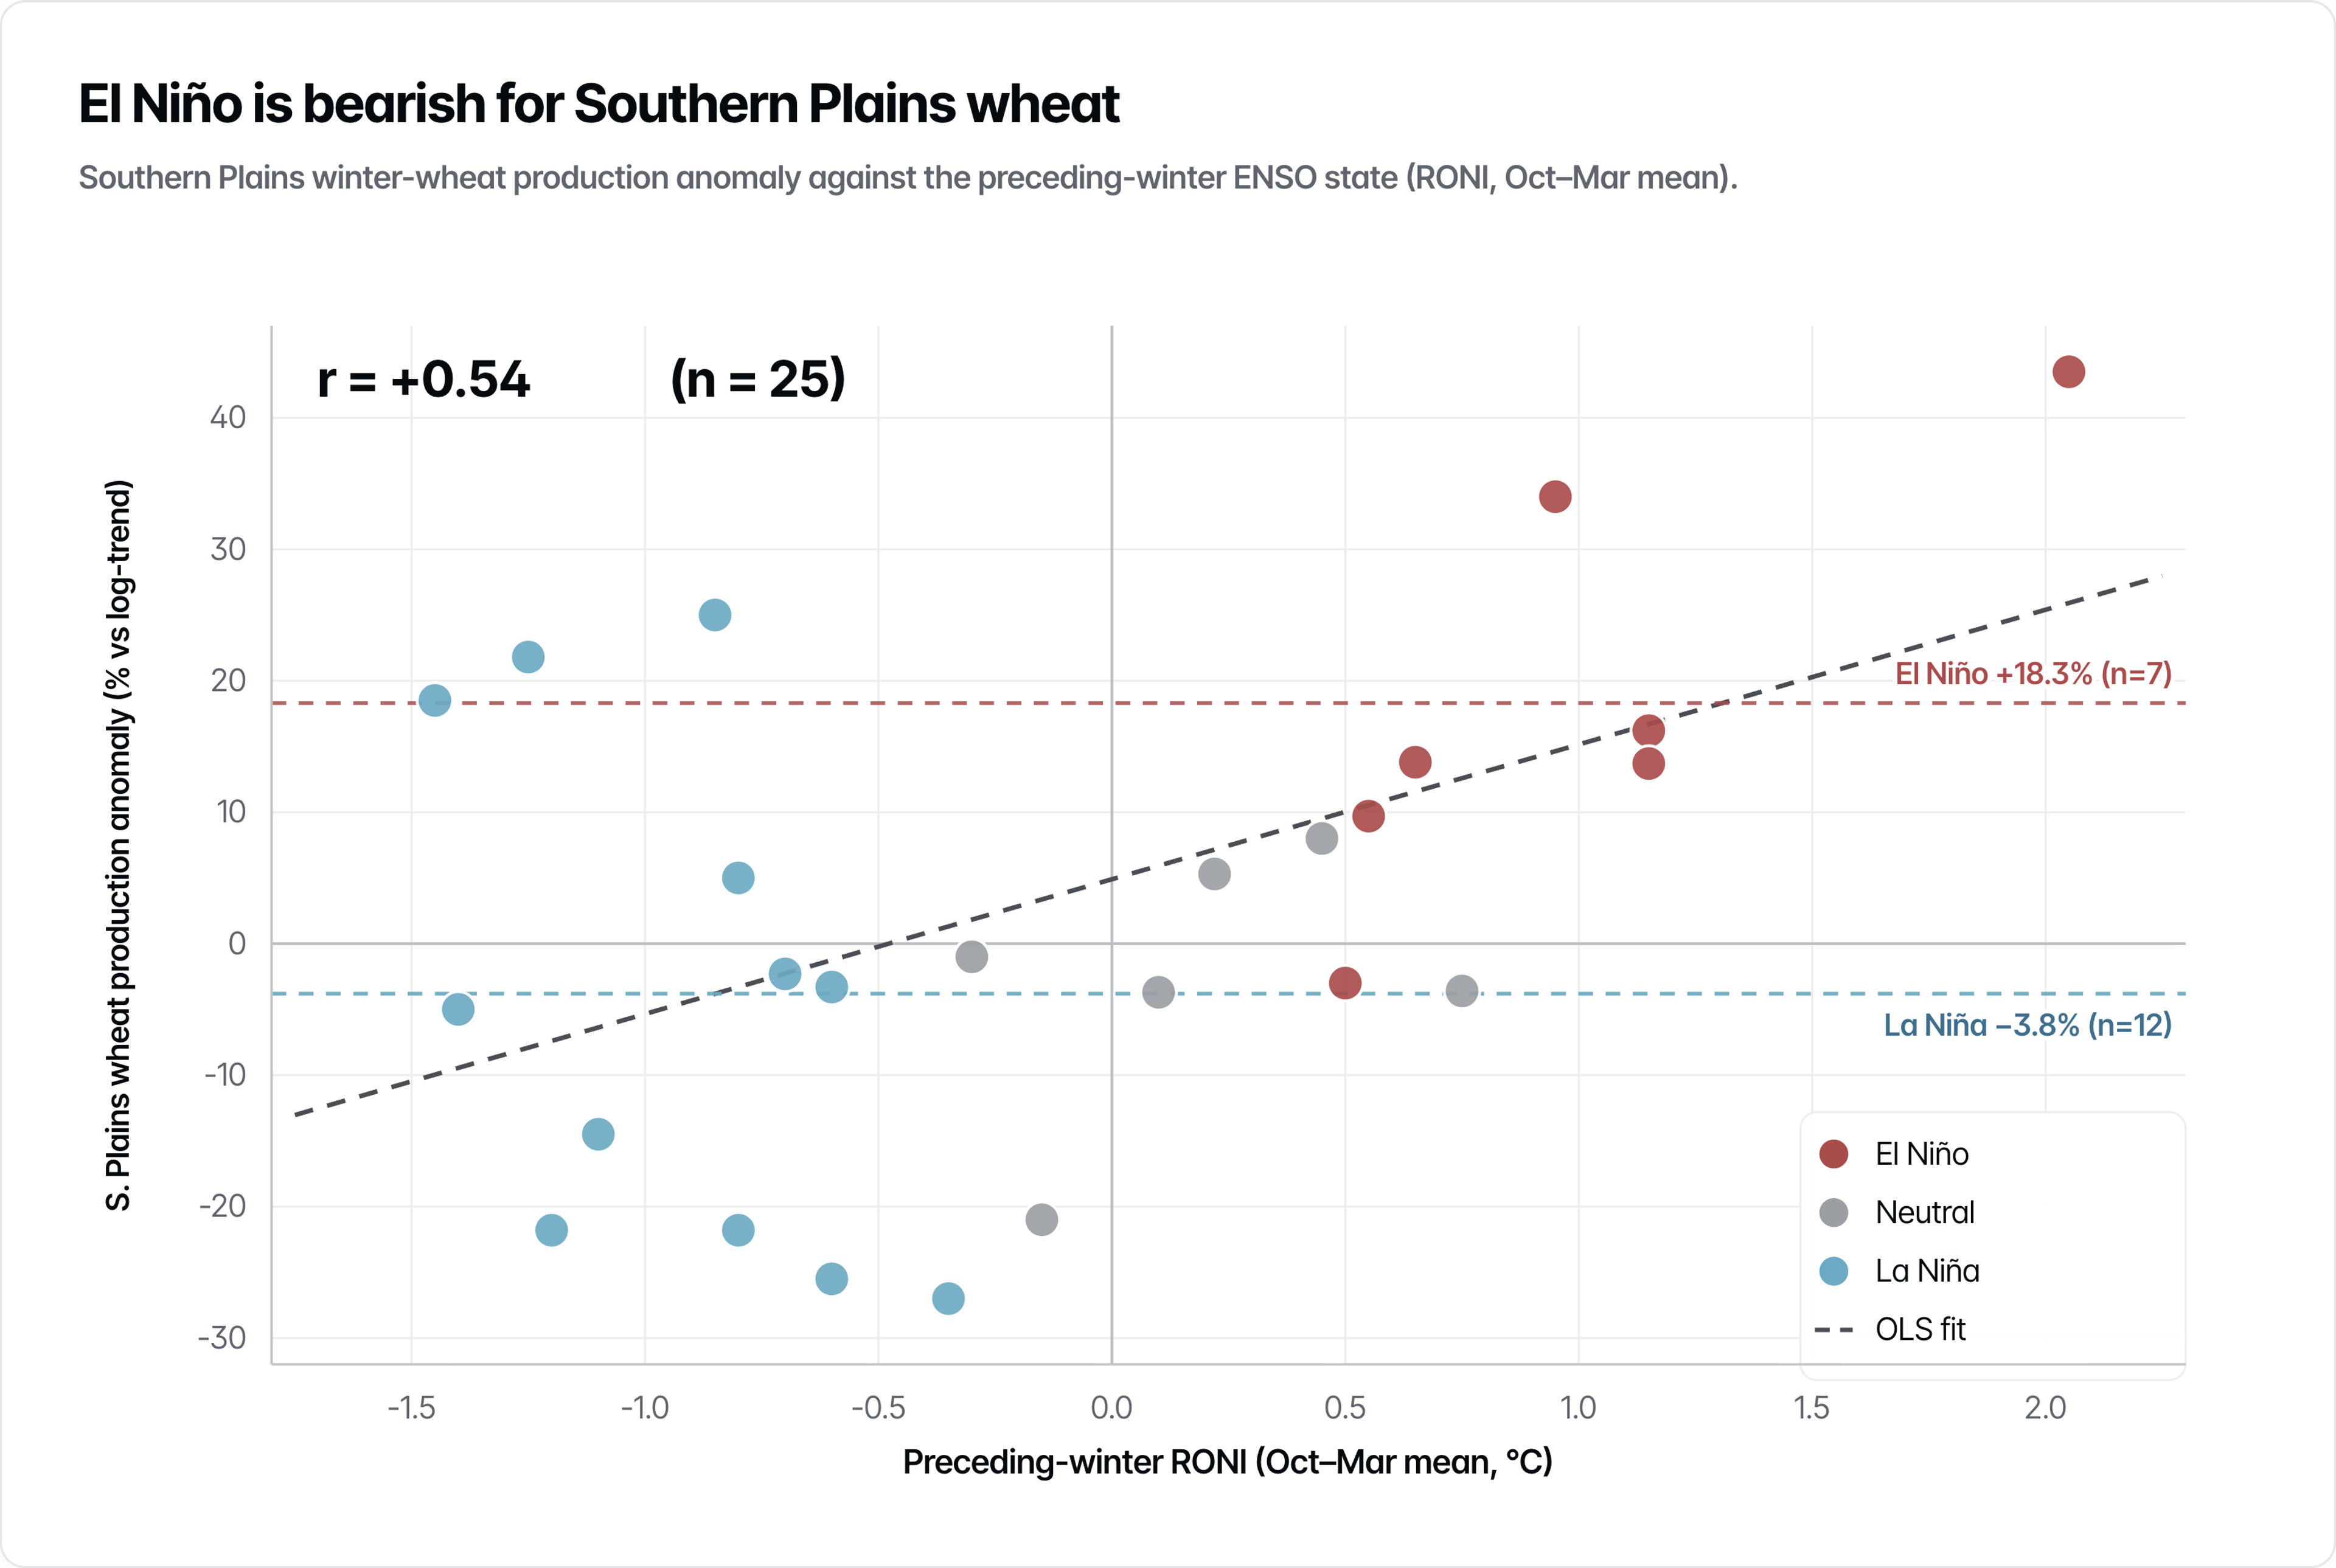
Southern Plains winter wheat - Texas, Oklahoma and Kansas - is sown in October and fills grain the following spring. Its entire growing season spans the November-January ENSO peak. El Niño tilts those winters wetter, recharging the soil moisture the crop draws on through spring and the yield response is measurable and consistent. Production in the three-state belt tracks the preceding-winter RONI at r = +0.54, running approximately 18% above trend in El Niño years and 4% below trend in La Niña years.
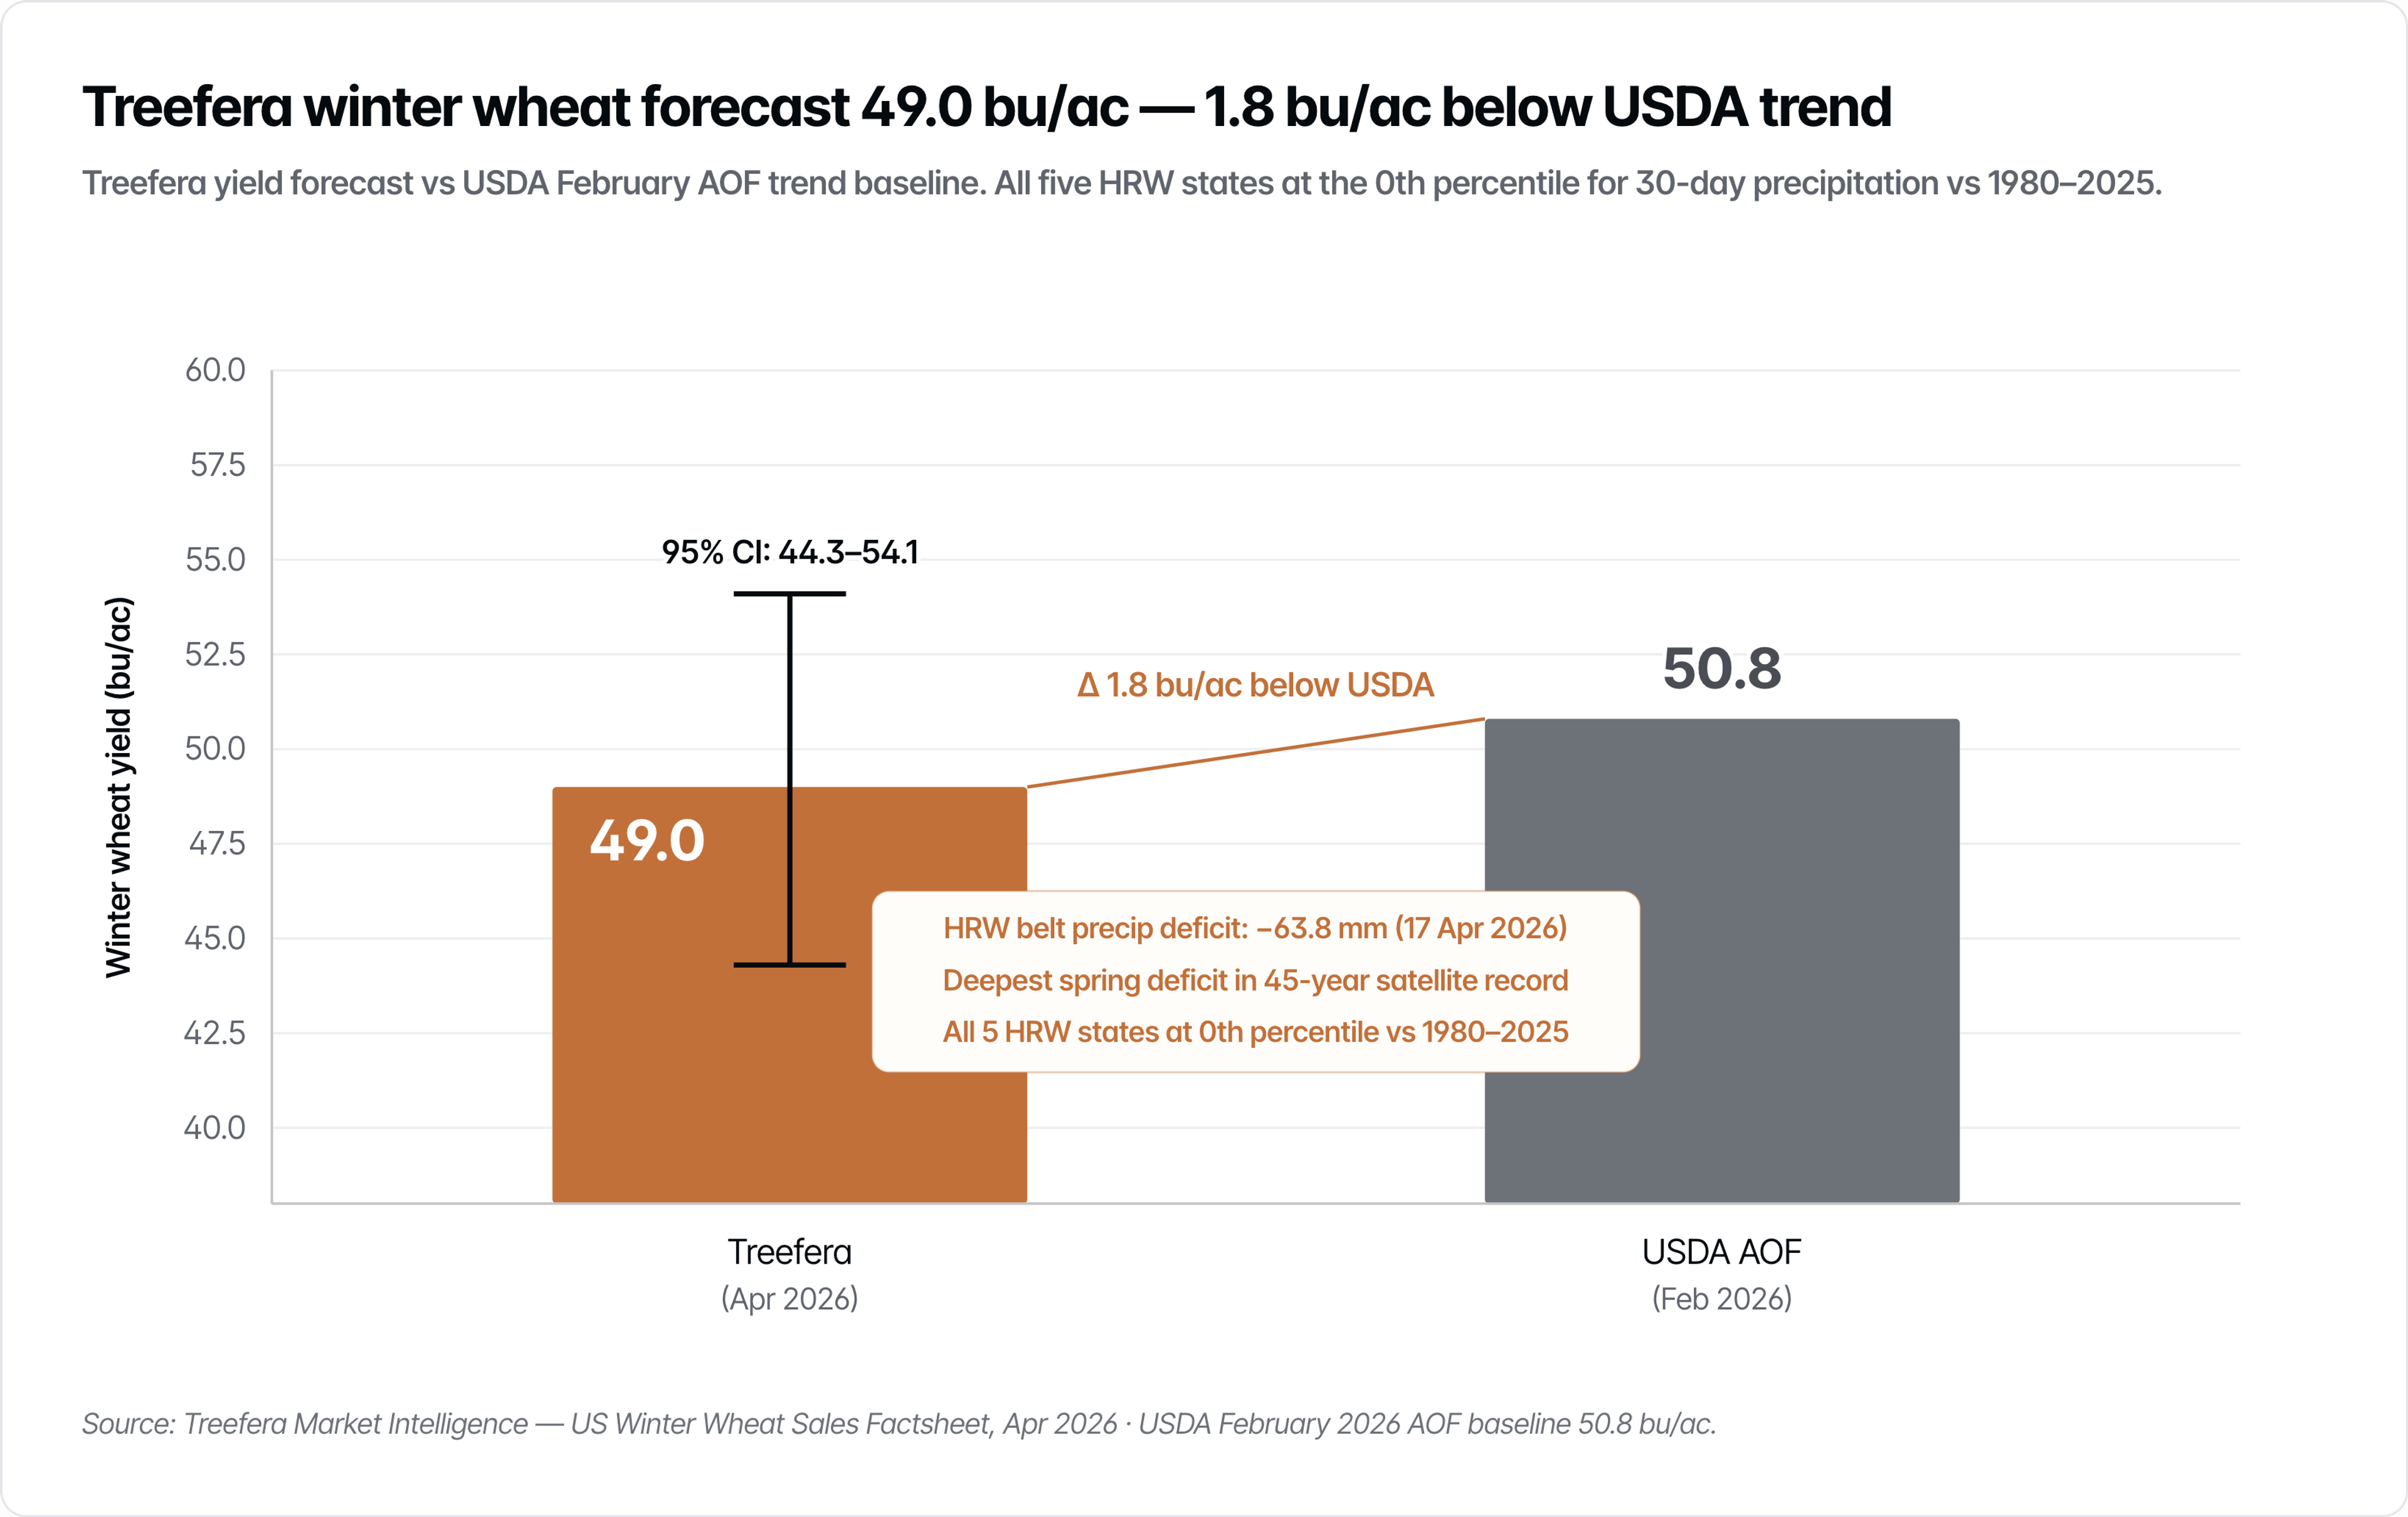
The 2025-26 season demonstrates what happens when El Niño's moisture signal is replaced by La Niña. The hard red winter (HRW) belt entered spring 2026 carrying a precipitation deficit of 63.8 millimetres against a 45-year ERA5 baseline – the deepest spring deficit on record, with all five HRW states at the 0th percentile against 1980-2025. Treefera's Southern Plains stress trajectory for 2026 reached 0.95 in April, the highest reading since records began, exceeding the 2022 La Niña season at 0.79.
The field signals confirm the stress. USDA NASS crop progress data shows 2026 winter wheat heading running two to three weeks earlier than the five-year historical range through April and May. Heat-driven early heading compresses the grain-fill window and concentrates drought exposure in the weeks of maximum moisture demand. Good-and-excellent ratings fell to 31% nationally in May, approaching the historical floor; readings below 35% in May have consistently preceded elevated abandonment in HRW states.
Treefera's yield forecast for 2026 stands at 49.0 bushels per acre, with a 95% confidence interval of 44.3-54.1, against USDA's February Area and Operations Forecast trend baseline of 50.8.
Corn
US corn presents a fundamentally different ENSO relationship, and the reason is mechanical. Corn is planted in May and reaches its critical vulnerability - pollination - in mid-July. By the time corn is at risk, El Niño's atmospheric consequences have decayed. The Pacific has moved on.
Composite the Corn Belt by ENSO phase across every year since 1950, and growing-season stress is flat. The detrended yield response sits within an eighth of a standard deviation of zero. This is not a correlation too small to act on. It is the absence of a mechanism. Nothing connects El Niño's November-January peak to corn's mid-July pollination window.
The events that shaped corn market memory are routinely misattributed to El Niño. The 1988 price surge was the great La Niña drought. The 2012 shock - a heat dome that cut US yield by more than 25% - is attributed by NOAA to internal atmospheric variability rather than Pacific state. The 2007 spike reflected the ethanol mandate and a structural demand shift. Each appears in commodity retrospectives as an ENSO event. None was caused by El Niño.
What the first-mile data shows for corn in 2026
The absence of an ENSO signal on corn does not mean the 2026 corn outlook is benign. It means the risks originate elsewhere.
Treefera's Greenprint Weather Pipeline shows deep root-zone soil moisture (100-289 centimetres depth) at the 2nd percentile in Iowa, Illinois and Missouri — three states that together produce 43% of the US corn crop. Surface and shallow soil moisture in those same states registers at the 32nd-57th percentile, which is why headline crop progress data has not yet flagged the deficit. The drought is sub-surface, invisible to standard survey-based reporting, and it sits precisely where corn roots draw during July heat stress.
At the state level, Treefera's phenology-weighted stress z-scores as of late April show Nebraska at -1.5, Kansas at -1.1 and Missouri at -0.8. Iowa, the largest single-state corn producer, sits at -0.6, consistent with the root-zone percentile reading but below the surface signal that crop condition ratings currently capture.
December 2026 corn futures are priced near $4.75 per bushel with implied volatility at 22.58%. The market is pricing a benign summer.
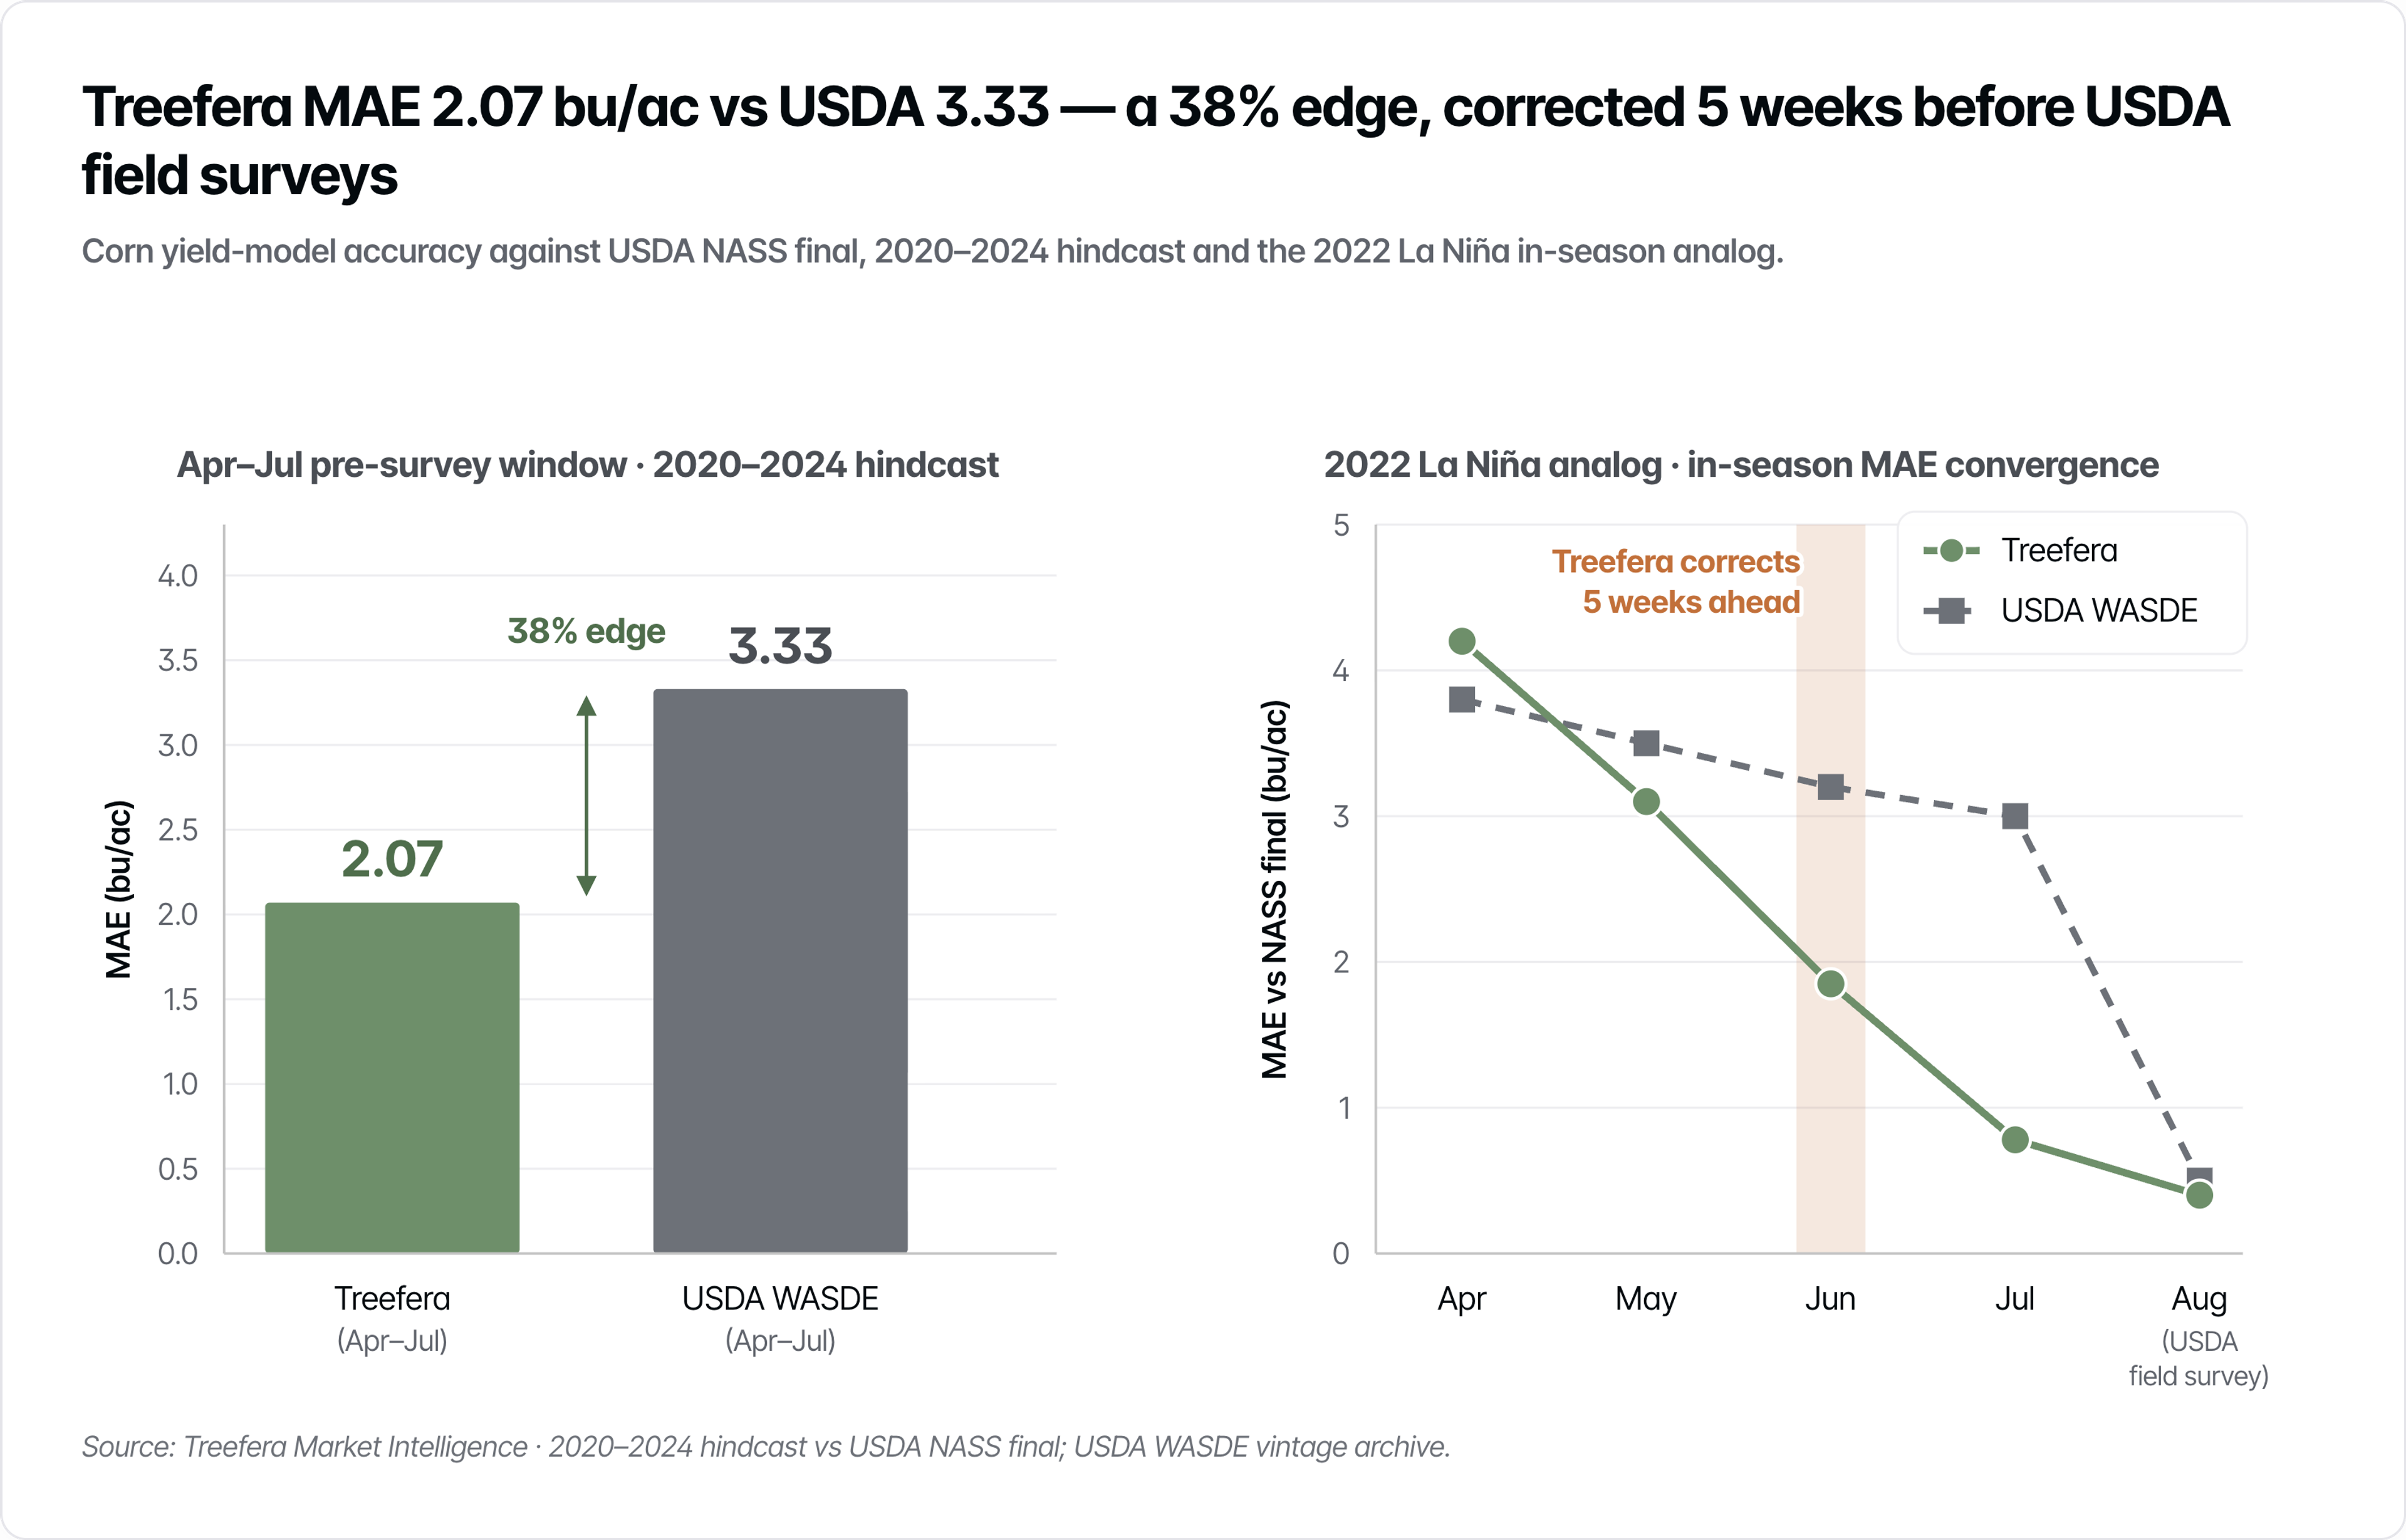
Treefera's corn yield model achieved a mean absolute error of 2.07 bushels per acre over 2020-2024 against USDA WASDE's 3.33, a 38% analytical edge in the pre-survey window.
El Niño will not cause the next US corn correction. The deep soil moisture deficit, accumulated through a La Niña winter and now sitting below the surface of the standard data, is already in position to do it.
Insights
Recent News

COMMODITIES INSIGHTS
15 July 2026
El Niño's Split Signal on Coffee: Why the Two Beans Move in Opposite Directions
As of mid-2026, arabica futures sit near 275¢ per pound against a Rabobank central target of 225¢, with market consensus at 74 million bags implying an 8.7 million bag surplus for the new Brazilian cr…