El Niño is coming through the 2026-27 season and forecasts are stating it to be strong.
Every major forecasting centre has converged on a strong El Niño through the November-January peak. A sea-surface temperature reading alone does not tell you what happens to a harvest. The work is in tracing that Pacific signal through crop footprints, growing windows and market conditions — which is what the report and the four commodity reads below do for coffee, cocoa, US wheat and US corn.
Why the same El Niño produces different commodity outcomes
A single El Niño forecast does not move coffee, cocoa, wheat and corn the same way, or even in the same direction.
Southern Plains winter wheat production tracks the preceding-winter RONI at r = +0.54, running about 18% above trend in El Niño years. US corn shows no equivalent relationship - its pollination window falls in mid-July, months after El Niño's atmospheric signal has decayed. Robusta coffee faces a real drought risk in Vietnam's Central Highlands (RONI vs. rainfall, r = -0.69), largely absorbed by irrigation. Arabica's dominant risk is frost, and El Niño reduces it. West Africa's cocoa belt runs hotter and drier in five of the seven years closest to the current forecast, but the same-sized event in 1982-83 produced no price move at all, because the market was in surplus at the time.
The difference comes down to geography, crop calendar and standing market conditions - the variables a single ocean index does not capture.

Access the full ENSO 2026-27 First-Mile Briefing
This report explores the question everyone in softs and ags is asking: how will the ENSO impact vary around the world?
Four principles behind every commodity read in this report
Footprint-weighted climate stress
A regional anomaly matters only in proportion to where the crop actually grows. Every climate signal Treefera processes is weighted by the spatial distribution of the crop canopy, not by administrative boundaries or simple geographic averages.
Satellite vs. publication lag
Treefera's Greenprint Weather Pipeline derives crop-stress indices, canopy health and soil moisture from ERA5 reanalysis and satellite observation, updating continuously. In 2026, the HRW wheat belt's record spring precipitation deficit was quantified in April - two months before the May WASDE confirmed the shock.
Biological window awareness
ENSO's atmospheric consequences peak in November through January and decay by spring. Winter wheat's growing season spans that window; US corn's mid-July pollination sits entirely outside it. Two crops in the same country and the same grain belt face opposite ENSO exposures, determined entirely by the calendar.
Reference-class benchmarking
For each commodity, Treefera matches the forecast RONI value to its closest historical analogues, then reconstructs what the weather actually did in those years. This isolates climate-driven outcomes from management- and stock-driven ones - which is how a Very Strong El Niño (1982-83) can hit the same cocoa belt as 2023-24 and produce no price spike at all.
Insights
Recent News
COMMODITIES INSIGHTS
15 July 2026
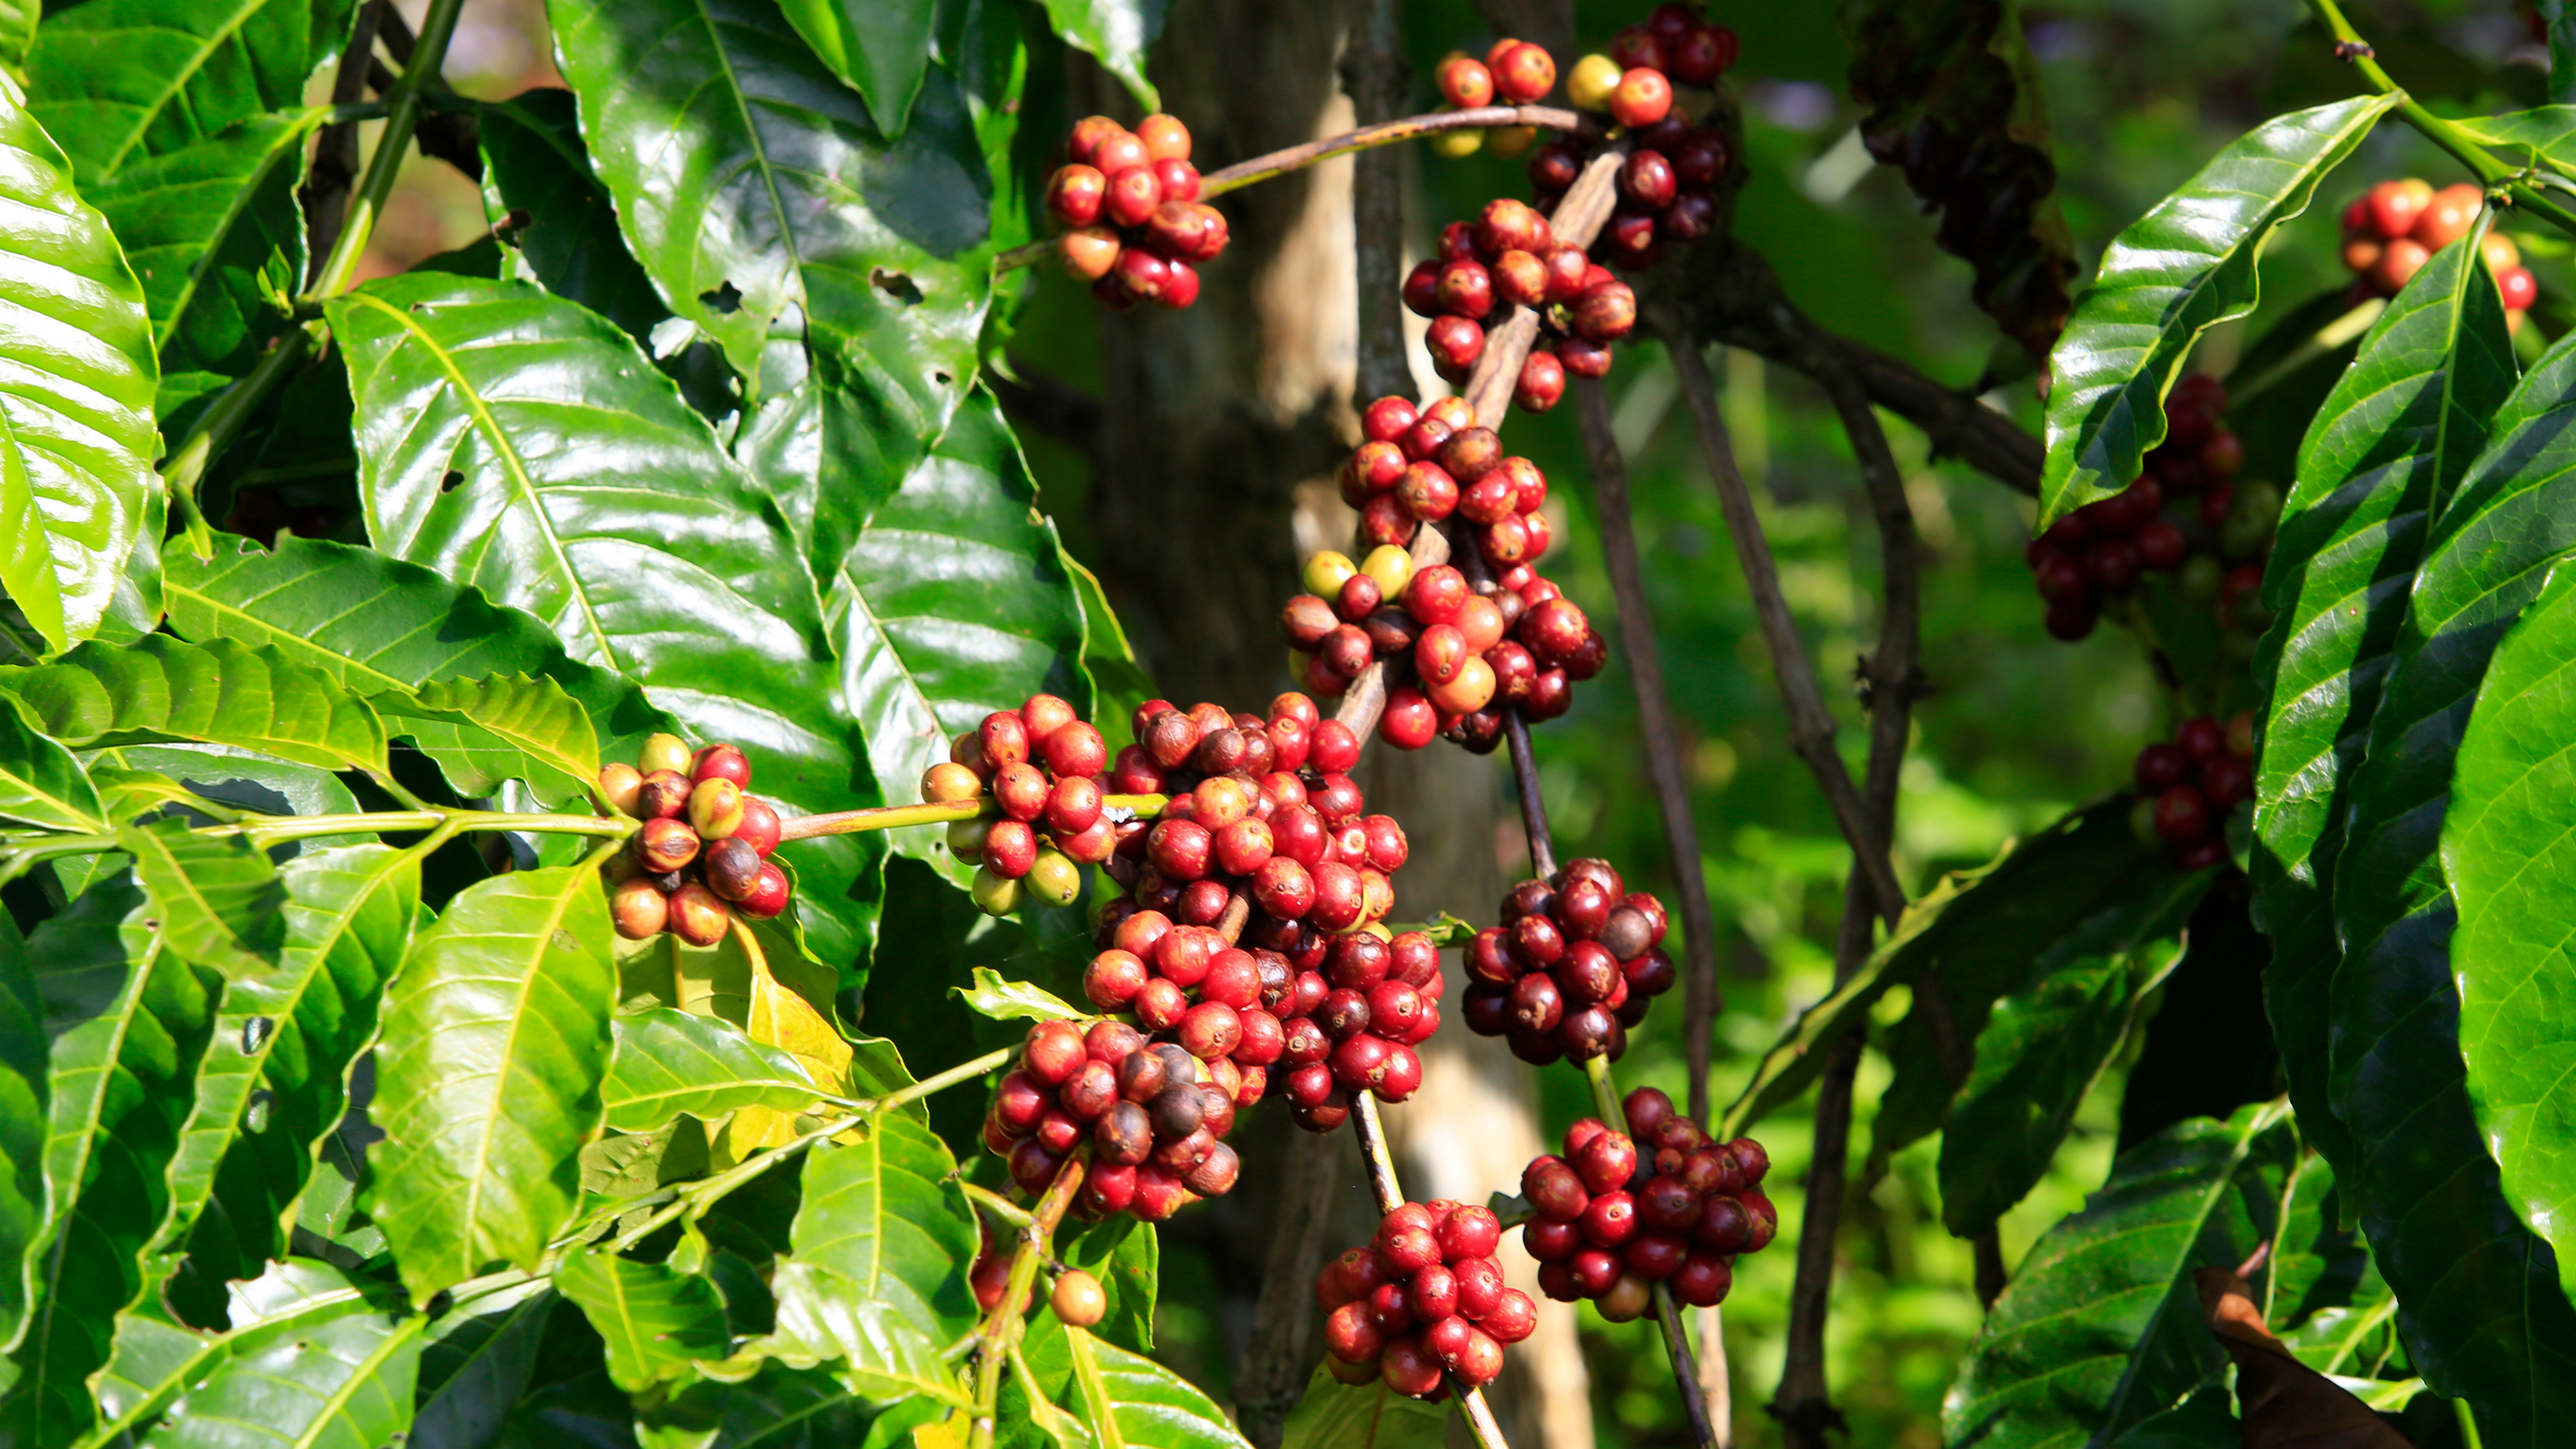
El Niño's Split Signal on Coffee: Why the Two Beans Move in Opposite Directions
As of mid-2026, arabica futures sit near 275¢ per pound against a Rabobank central target of 225¢, with market consensus at 74 million bags implying an 8.7 million bag surplus for the new Brazilian cr…
FAQ
ONI measures the raw temperature anomaly in the central Pacific against a 30-year baseline. As the whole tropical ocean warms, that baseline drifts, so ONI now reads consistently hot - the current forecast is the largest ever recorded on ONI. RONI strips out that shared warming and keeps only the relative contrast that actually reorganises the atmosphere. On RONI, the same forecast ranks sixth-strongest since 1950. Treefera builds from RONI because it is the gradient that drives the weather, not the headline number.
Clear Data. Clear Decisions.
Explore the full analogue methodology, the historical outcomes behind it, and Treefera's 2026-27 read for coffee, cocoa and US grains.
Unlock the full ENSO report