US Corn: See The Acres That Won’t Be Harvested
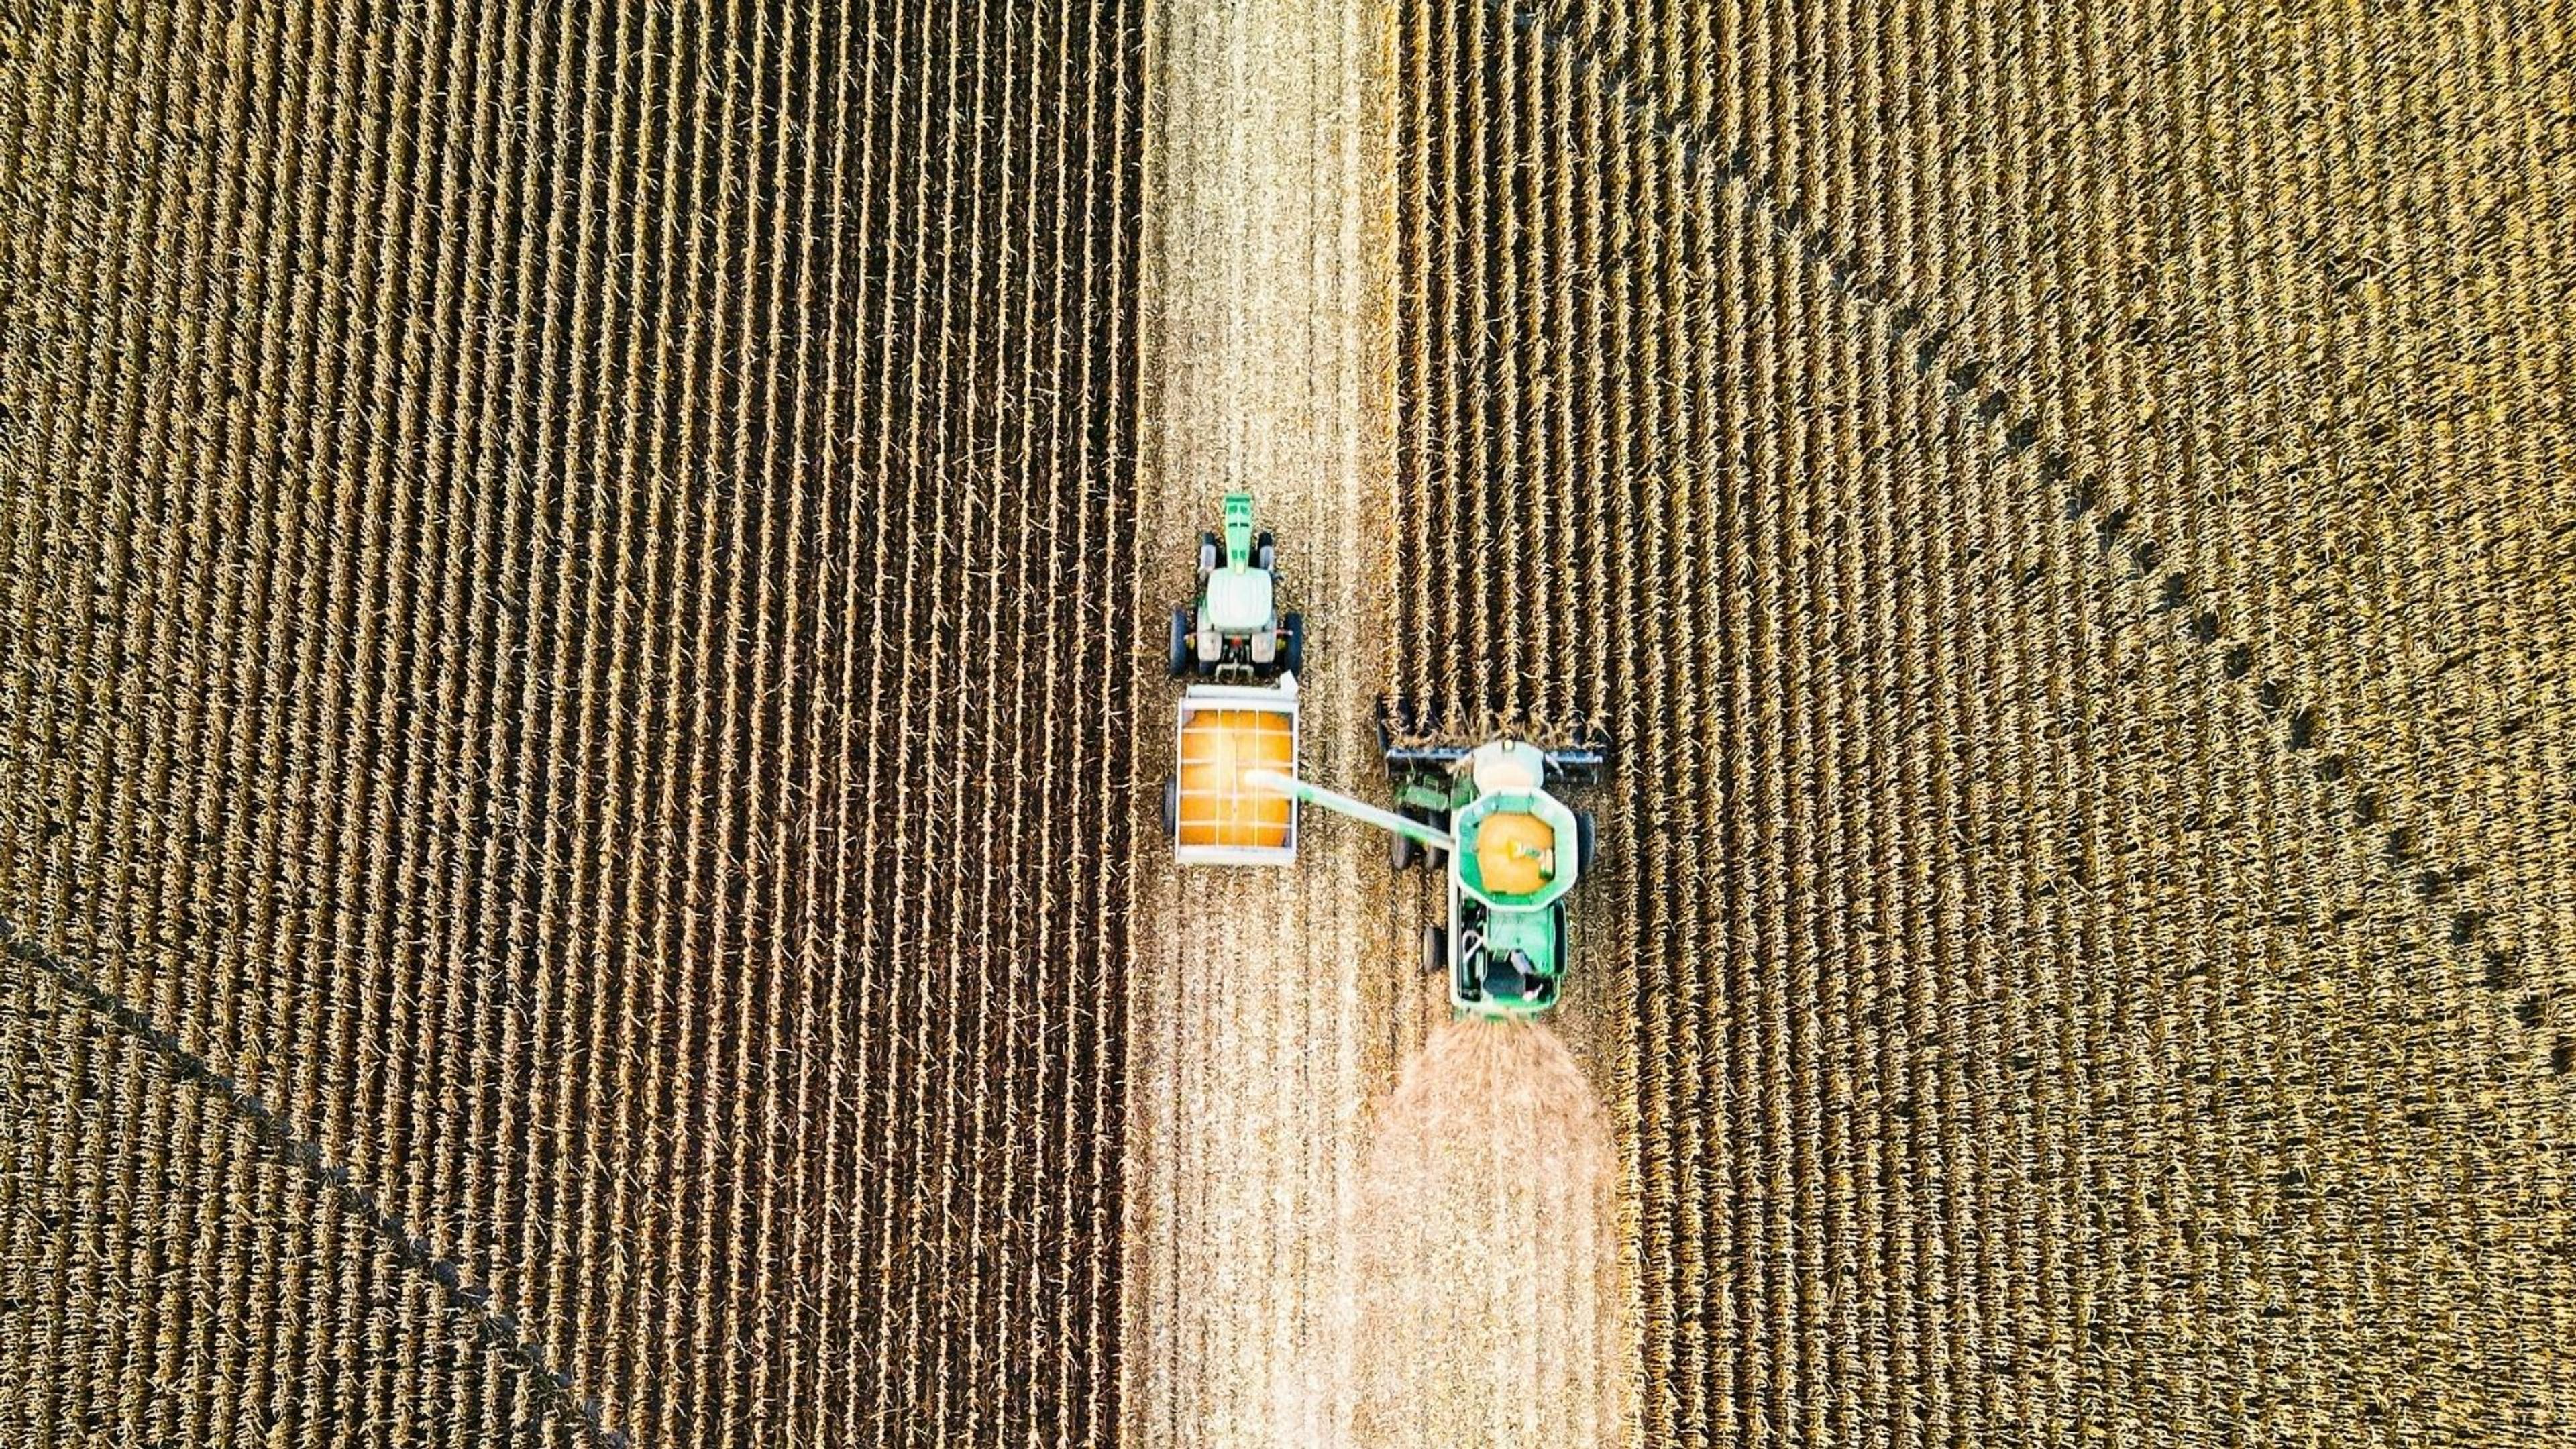
Treefera’s US corn production area forecast detects standing corn at plot level from satellite imagery and converts it to expected harvested area - independent of survey acreage. 31 weekly vintages from early April to late October, with calibrated prediction intervals on every one. USDA does not publish a harvested-area figure until 12 August.
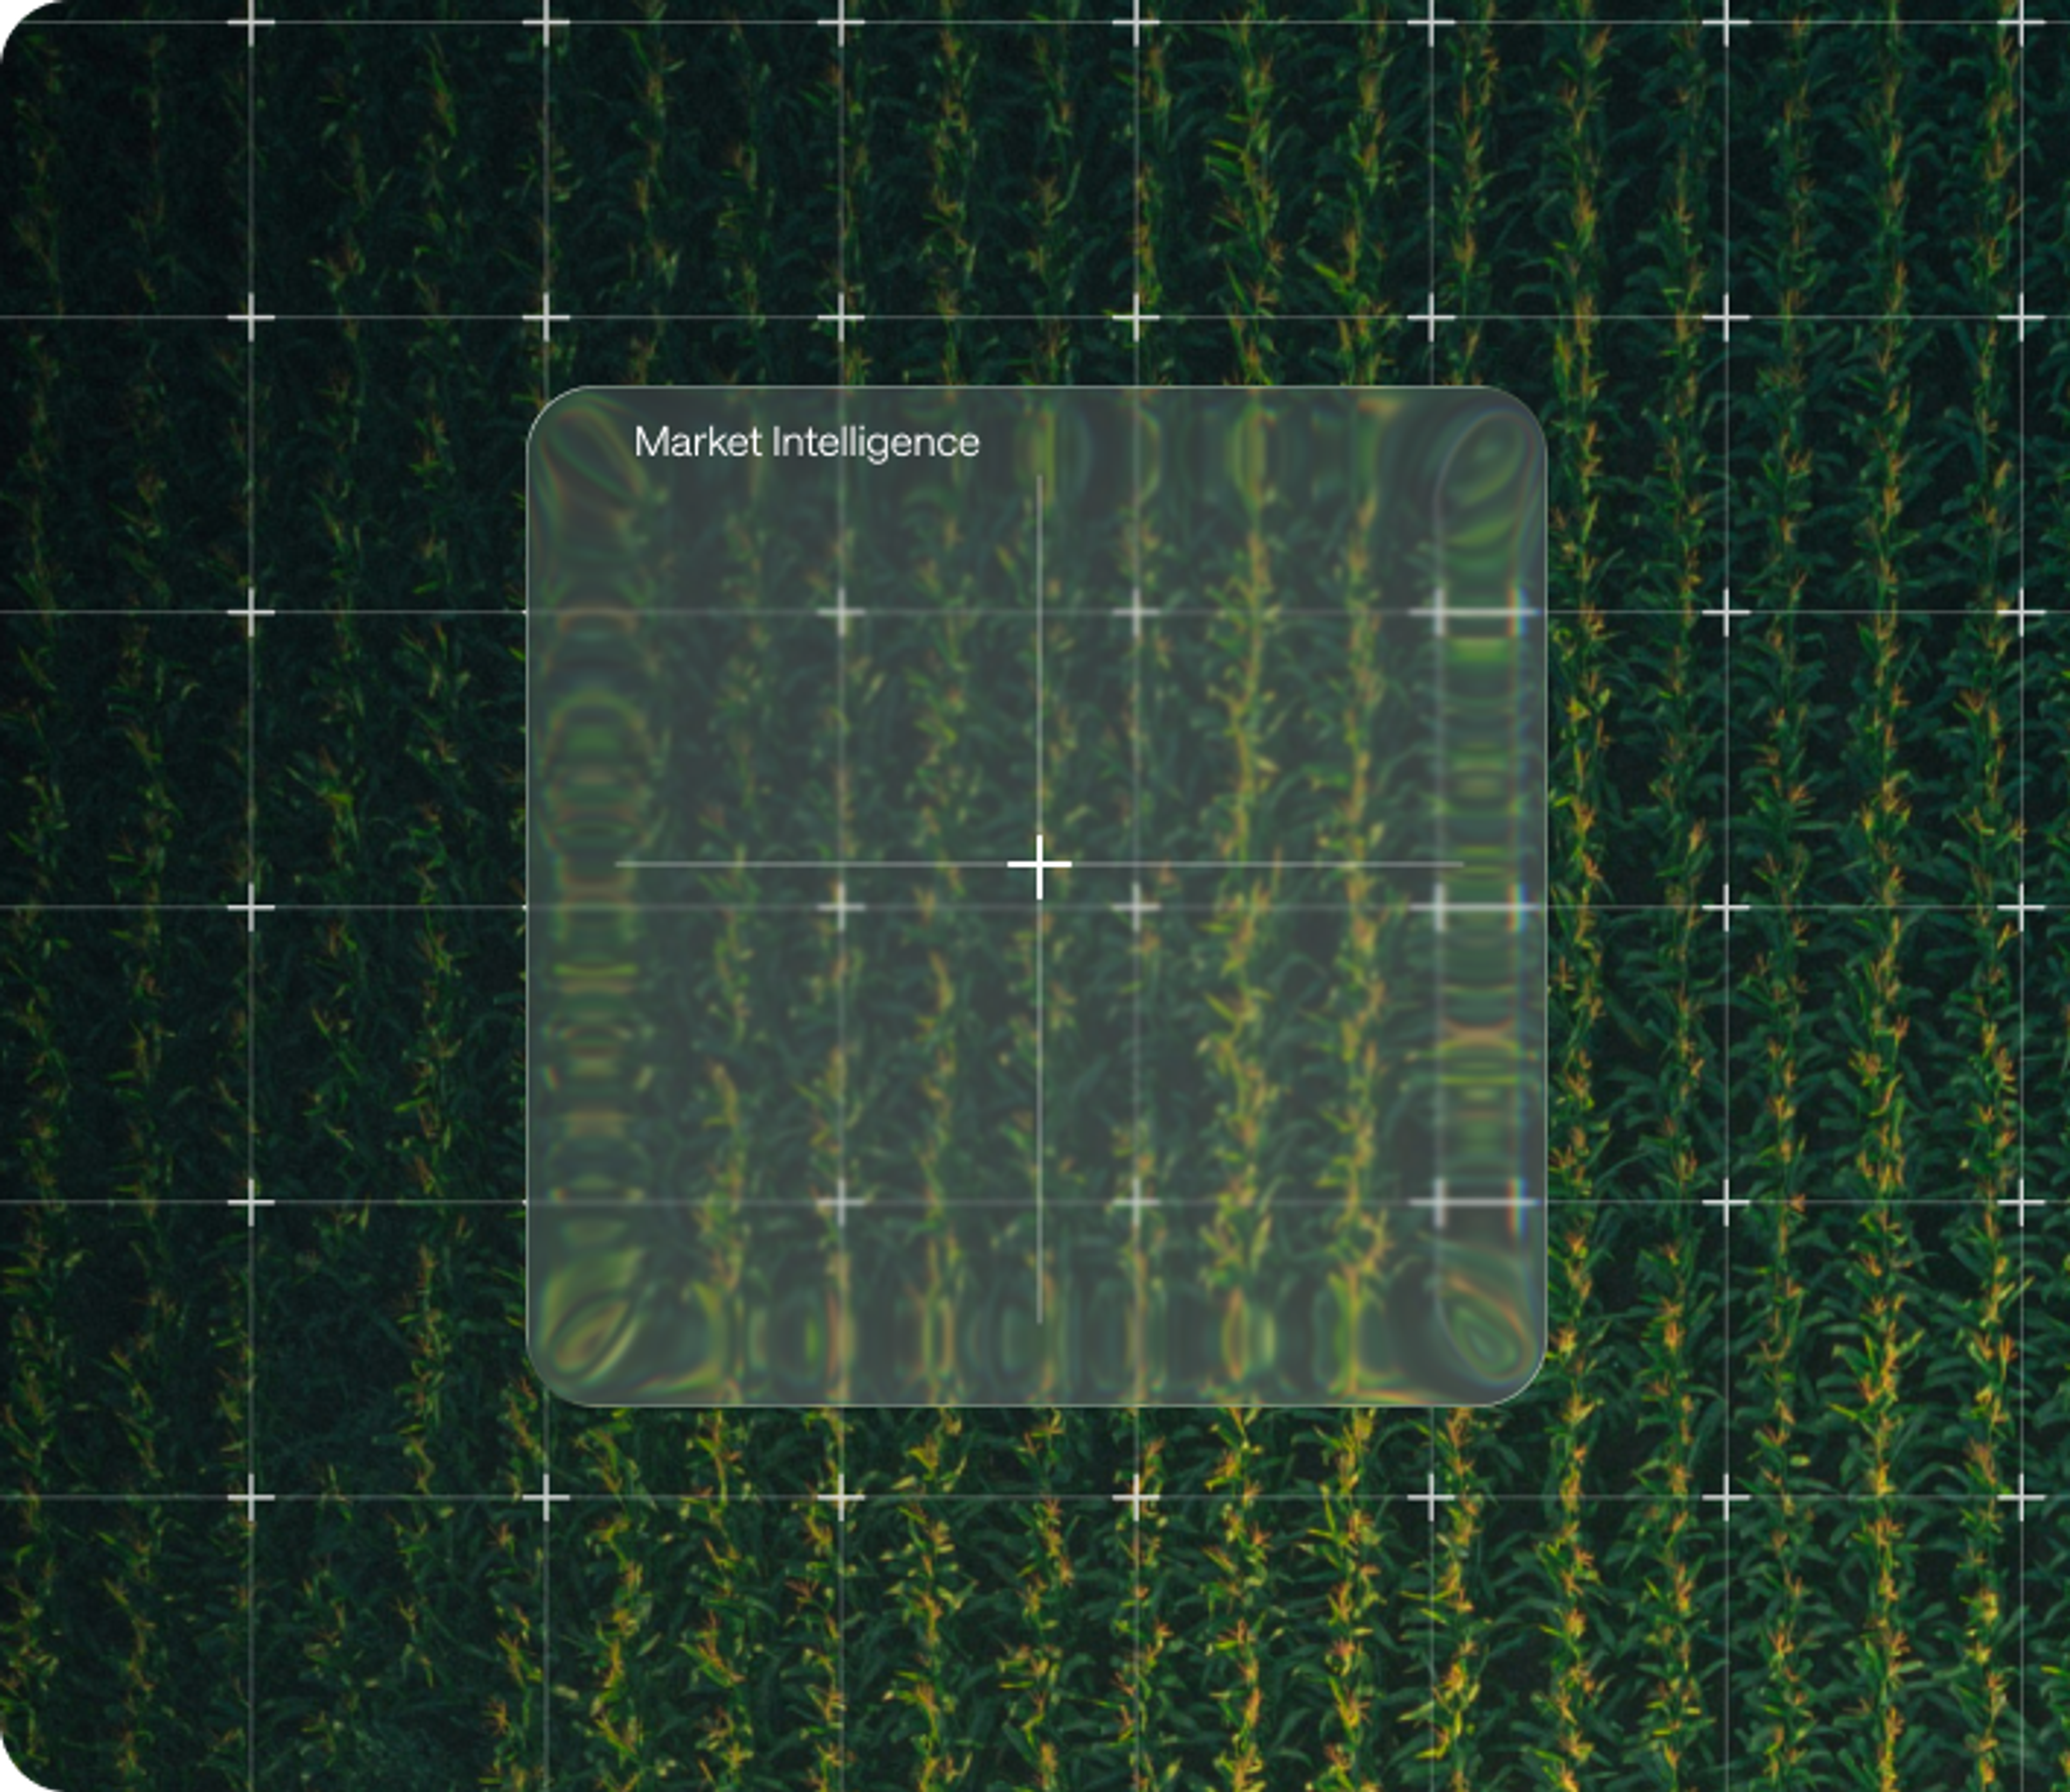

A record crop tracked from April. An abandonment year where NASS itself was wrong.
In 2023, US corn harvested area hit a record 35 million hectares. Treefera's model tracked it from April, finishing at 1.42% wMAPE before NASS published its first official estimate on August 12. Stable, early and accurate from the first vintage of the season.
In 2022, extreme drought drove the most difficult forecasting year in the backtest. NASS's own August estimate underestimated abandonment severity. Treefera's condition-weighted mechanism detected the divergence and adjusted. The model does not blindly defer to official anchors when crop conditions signal a larger abandonment event than the official figure shows. That is the product's most important property: independent signal when official sources are themselves uncertain.
15
weeks before NASS's first official harvested area estimate on August 12
0.76%
forecast error tracking 34 million hectares from April in 2021, the lowest in five years of backtesting
2.3M
acres - Treefera's average error from April. NASS typically revises by more than this between its own August and September estimates
Trusted for billion-dollar supply chain and risk management decisions.








Four reasons Treefera delivers information advantage
Earlier than any official source
Live from April, 15 weeks before NASS's first official harvested area estimate. 31 weekly vintages from planting through October, covering the full window when abandonment risk is highest and the market has no official figure to trade on.
Validated across five years, same model
2.74% wMAPE across 155 strictly out-of-sample test observations (5 years, 31 vintages). In 2023, 1.42% tracking a record crop from April. In 2021, 0.76%, the lowest annual error in the backtest. Same model specification, no year-specific tuning.
Independent when official sources are uncertain
Built on weather reanalysis, crop condition ratings and economic signals. In 2022, when NASS anchors underestimated drought-driven abandonment, the condition-weighted mechanism adjusted independently. Continuous through government shutdowns and data blackout periods.
Sub-regional precision
County-level predictions across 1,114 counties, aggregated using production weights. State-level planting shifts in Nebraska, Iowa and Illinois are visible in the county signal before NASS confirms them.
Insights
Recent News
FAQ
12 August, in the August Crop Production report - which is also the most heavily revised print of the year. Before that, March Prospective Plantings gives planted-area intentions and the June Acreage report confirms planted acres. Neither is harvested area. For roughly four months of every season, from early April to mid-August, no official harvested-area estimate exists at all.
Clear Data. Clear Decisions.
Walk through the model, five years of backtested results and the current 2026 signal - and assess whether it fits your workflow.
Request a demo