Thought Leadership
The Blind Spot in British Food Security
27 April 2026
Jonathan Horn | Andre Correia dos Santos | April 2026
Agricultural markets are entering a period of structural volatility. The signals are already visible in the UK's own production data.
The UK typically produces around 92% of its own wheat. In 2024, that figure fell to roughly 68%¹. Fresh vegetable self-sufficiency dropped to 53% – the lowest since 1988². Around 48% of the food the UK consumes is now imported². These are not rounding errors. They are the leading edge of a shift that existing data infrastructure was not built to track.
These numbers matter beyond agriculture. For a developed economy, the primary consequence of failing domestic production is not shortage – it is price. When domestic supply falls, import volumes rise and transport costs compound the pressure. Those costs pass through to food prices and food prices pass through to household budgets. Small disruptions in agricultural supply generate significant economic and political volatility, as the cost-of-living experience of the last three years confirms.
In the autumn of 2024, UK wheat production fell to 11.1 million tonnes – its lowest level in decades³ – and imports surged to a record 3.06 million tonnes⁴. Some of the best farmers in the country – people who know their land better than anyone, who can read a crop from the cab of a combine – were caught out by conditions that did not match anything in their experience.
That is the point. British farmers are not short of knowledge; decades of agronomic expertise, soil understanding and hard-won intuition have built one of the most productive arable sectors in Europe. Three of the five worst UK harvests since records began occurred this decade⁵. The 2024 season did not look like 2023, which did not look like 2020. When the patterns stop repeating, pattern-matching stops working – no matter how skilled the practitioner.
Farmers are not lacking in skill. What they need is the kind of quantified, forward-looking intelligence that would let them compare their own yield trajectory to regional peers and to the drivers of world price – a US yield forecast available weeks ahead of official reports, set alongside their own acres. That intelligence does not just help individual farms. It improves the operation of the market, narrowing the information advantage currently held by the best-resourced trading desks – the counterparties on the other side of every grain trade.
In the UK, that layer of intelligence does not exist at the scale required – and the consequences reach well beyond the farm gate.
The data gap
The UK publishes crop production data once a year. Provisional estimates arrive in October – weeks after the August harvest, but before the season's full picture is clear. Final figures follow in December. During the growing season – April through to harvest in August – AHDB issues qualitative crop condition reports roughly every four to five weeks⁶. There is no weekly crop progress reporting. No sub-county yield tracking. No quantified pre-harvest production intelligence.
Compare this to the United States, where the USDA publishes weekly crop progress reports from April to November and monthly supply and demand estimates through WASDE⁷. County-level yield data is drawn from a federal crop insurance programme covering around 85% of planted acres⁸ – generating field-level yield records as a standard byproduct. The EU's MARS bulletins provide monthly satellite-informed crop assessments across member states.
The UK sits behind both peers. Not marginally – structurally.
Research from Rothamsted⁹ has identified the lack of accessible data on crop management, protection and physiology as a fundamental bottleneck for predicting UK crop yields. The Dimbleby National Food Strategy recommended a National Food System Data Programme in 2021¹⁰. Five years on, that programme does not exist.
This gap is not improving – it is widening. Government agricultural reporting across major economies is lagging further behind commercial reality, underfunded and in some cases actively defunded. At a recent conference on alternative data, private companies described generating more accurate real-time signals on economic conditions than central banks – using satellite imagery and AI-driven pipelines. The concept is called nowcasting: knowing what is actually happening before official statistics arrive. That is precisely what agricultural markets lack, at precisely the moment when volatility makes it most consequential.
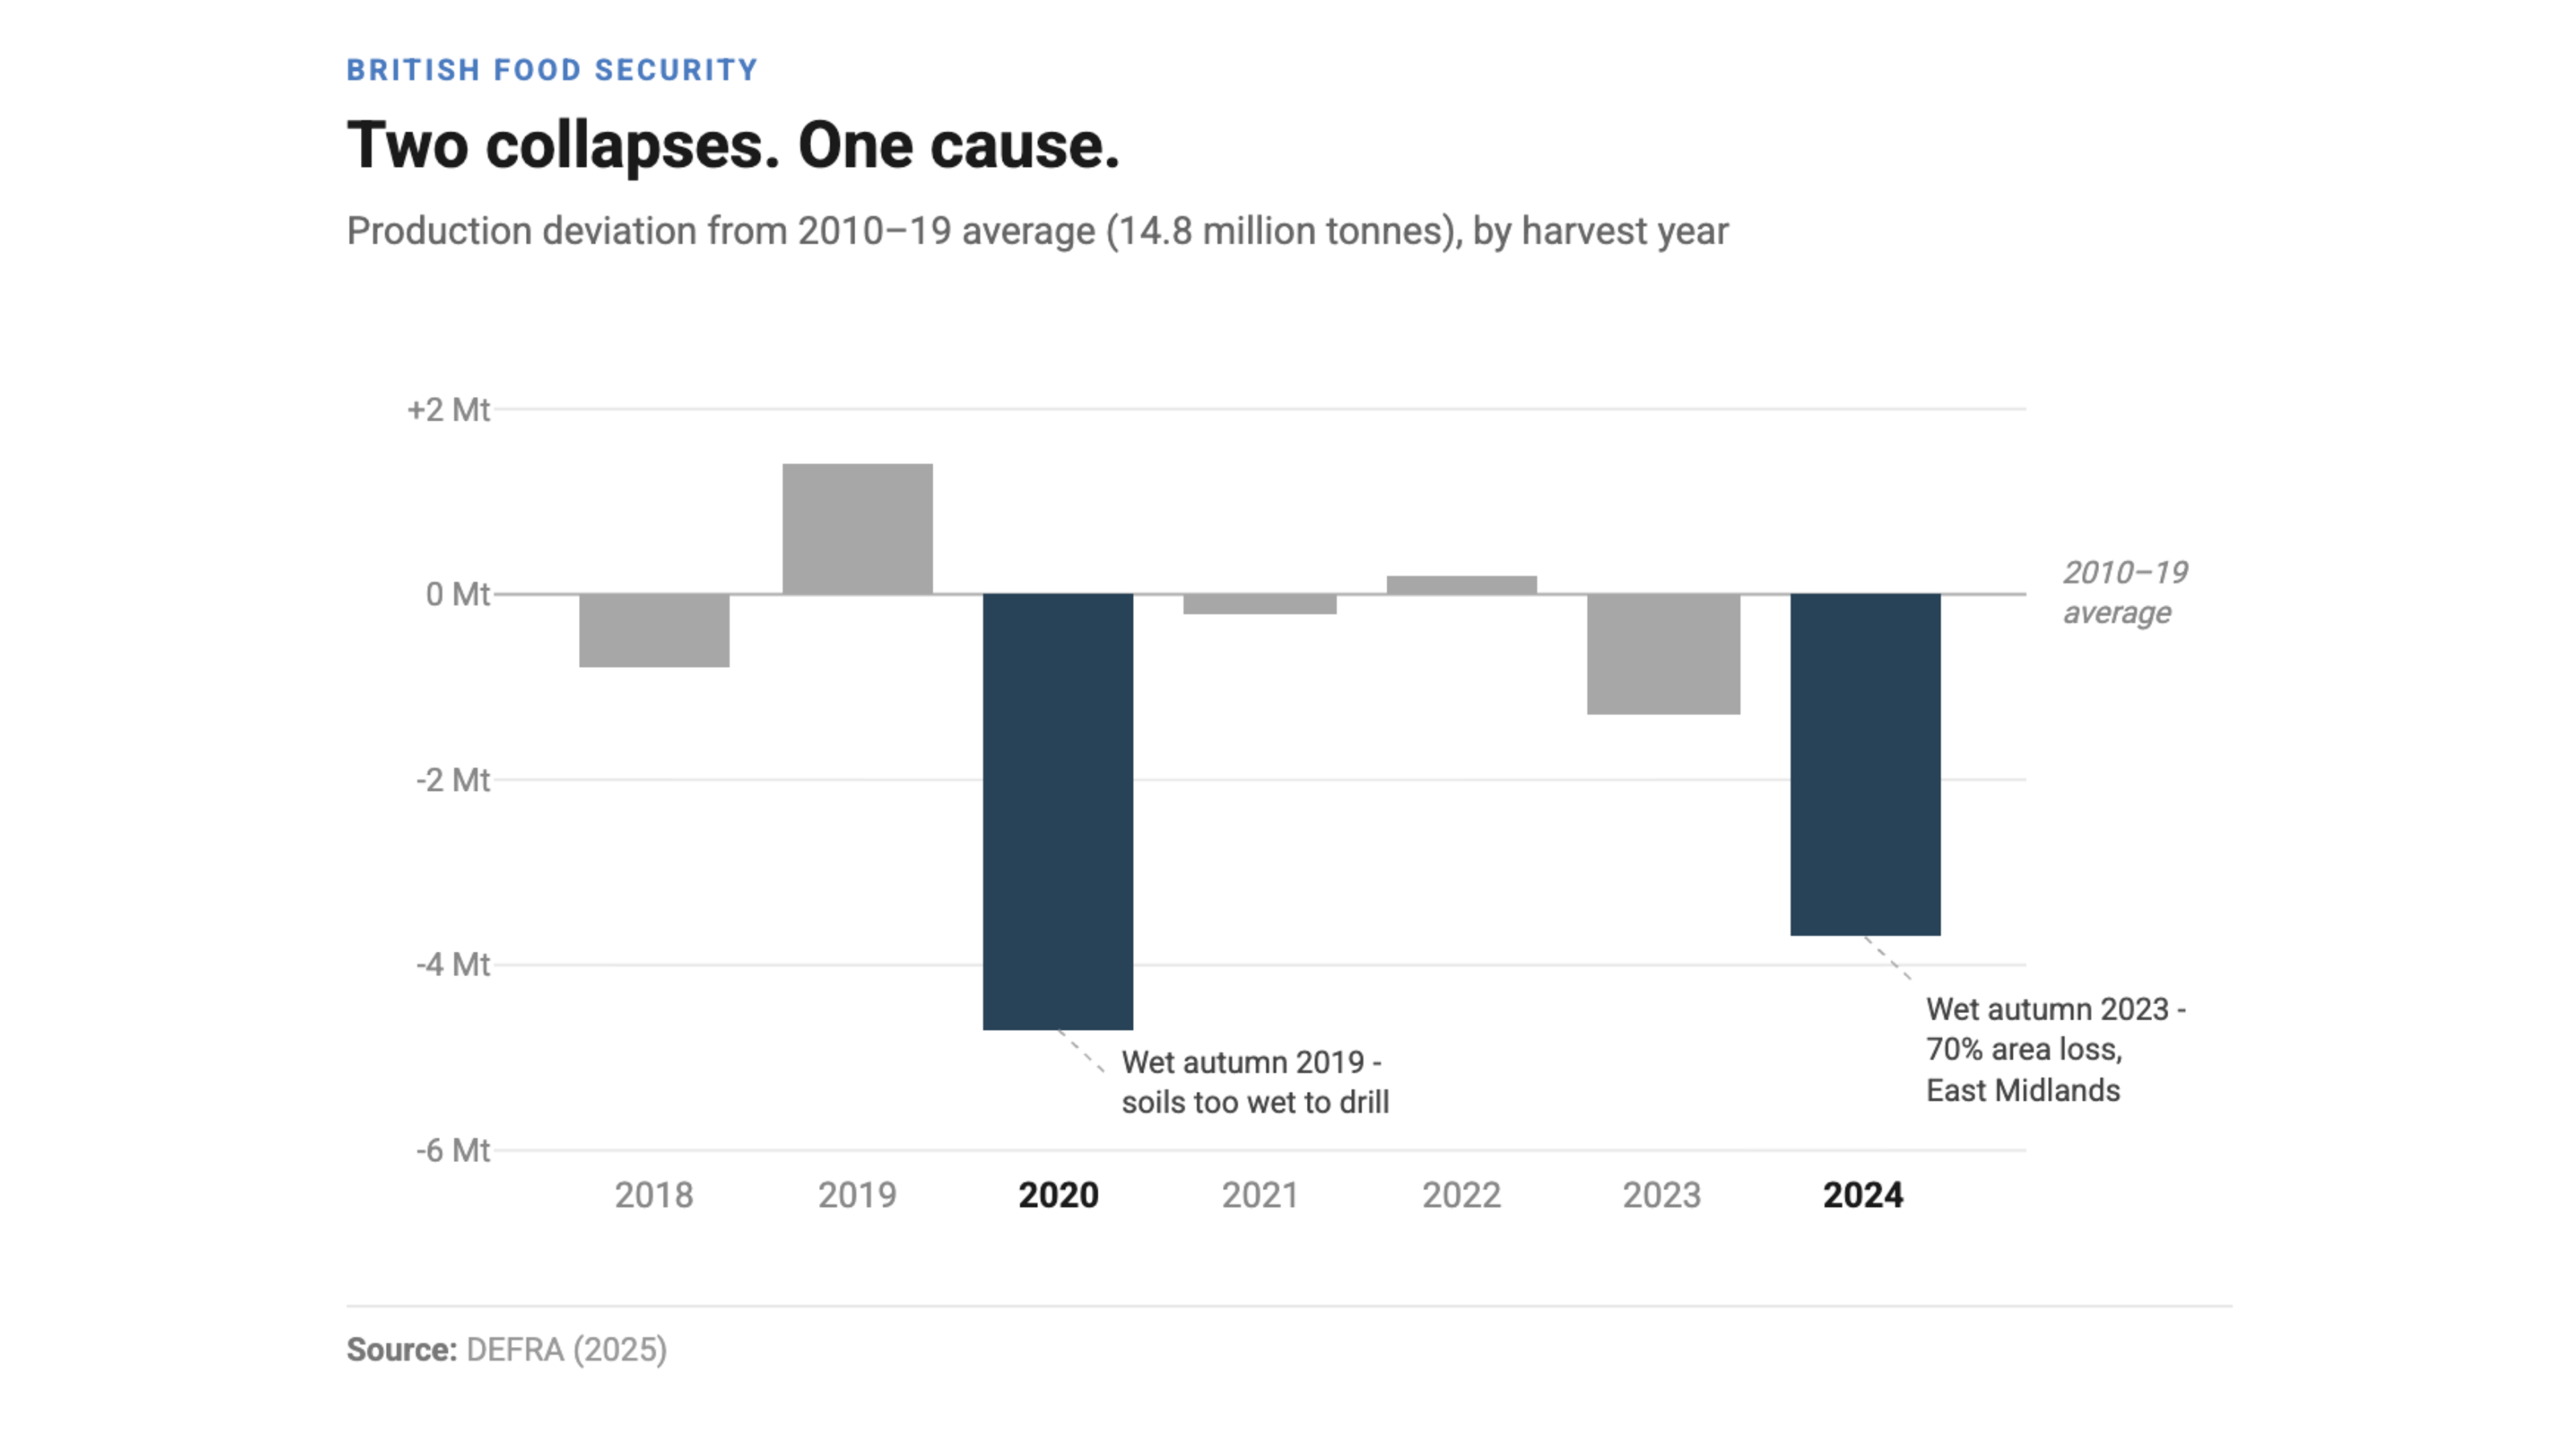
Two collapses. One Cause. Source: DEFRA (2025)
A world that does not change gradually
The cumulative losses from recent UK harvest failures are estimated at £2.3 billion¹¹. The nature of the damage matters as much as the scale. In 2024, autumn-sown crop area fell 70% in the East Midlands because waterlogged soils prevented drilling entirely¹². That is not a gentle decline. Soil that is 5% too wet still gets planted; soil that is 10% too wet does not. It is a step function, not a slope.
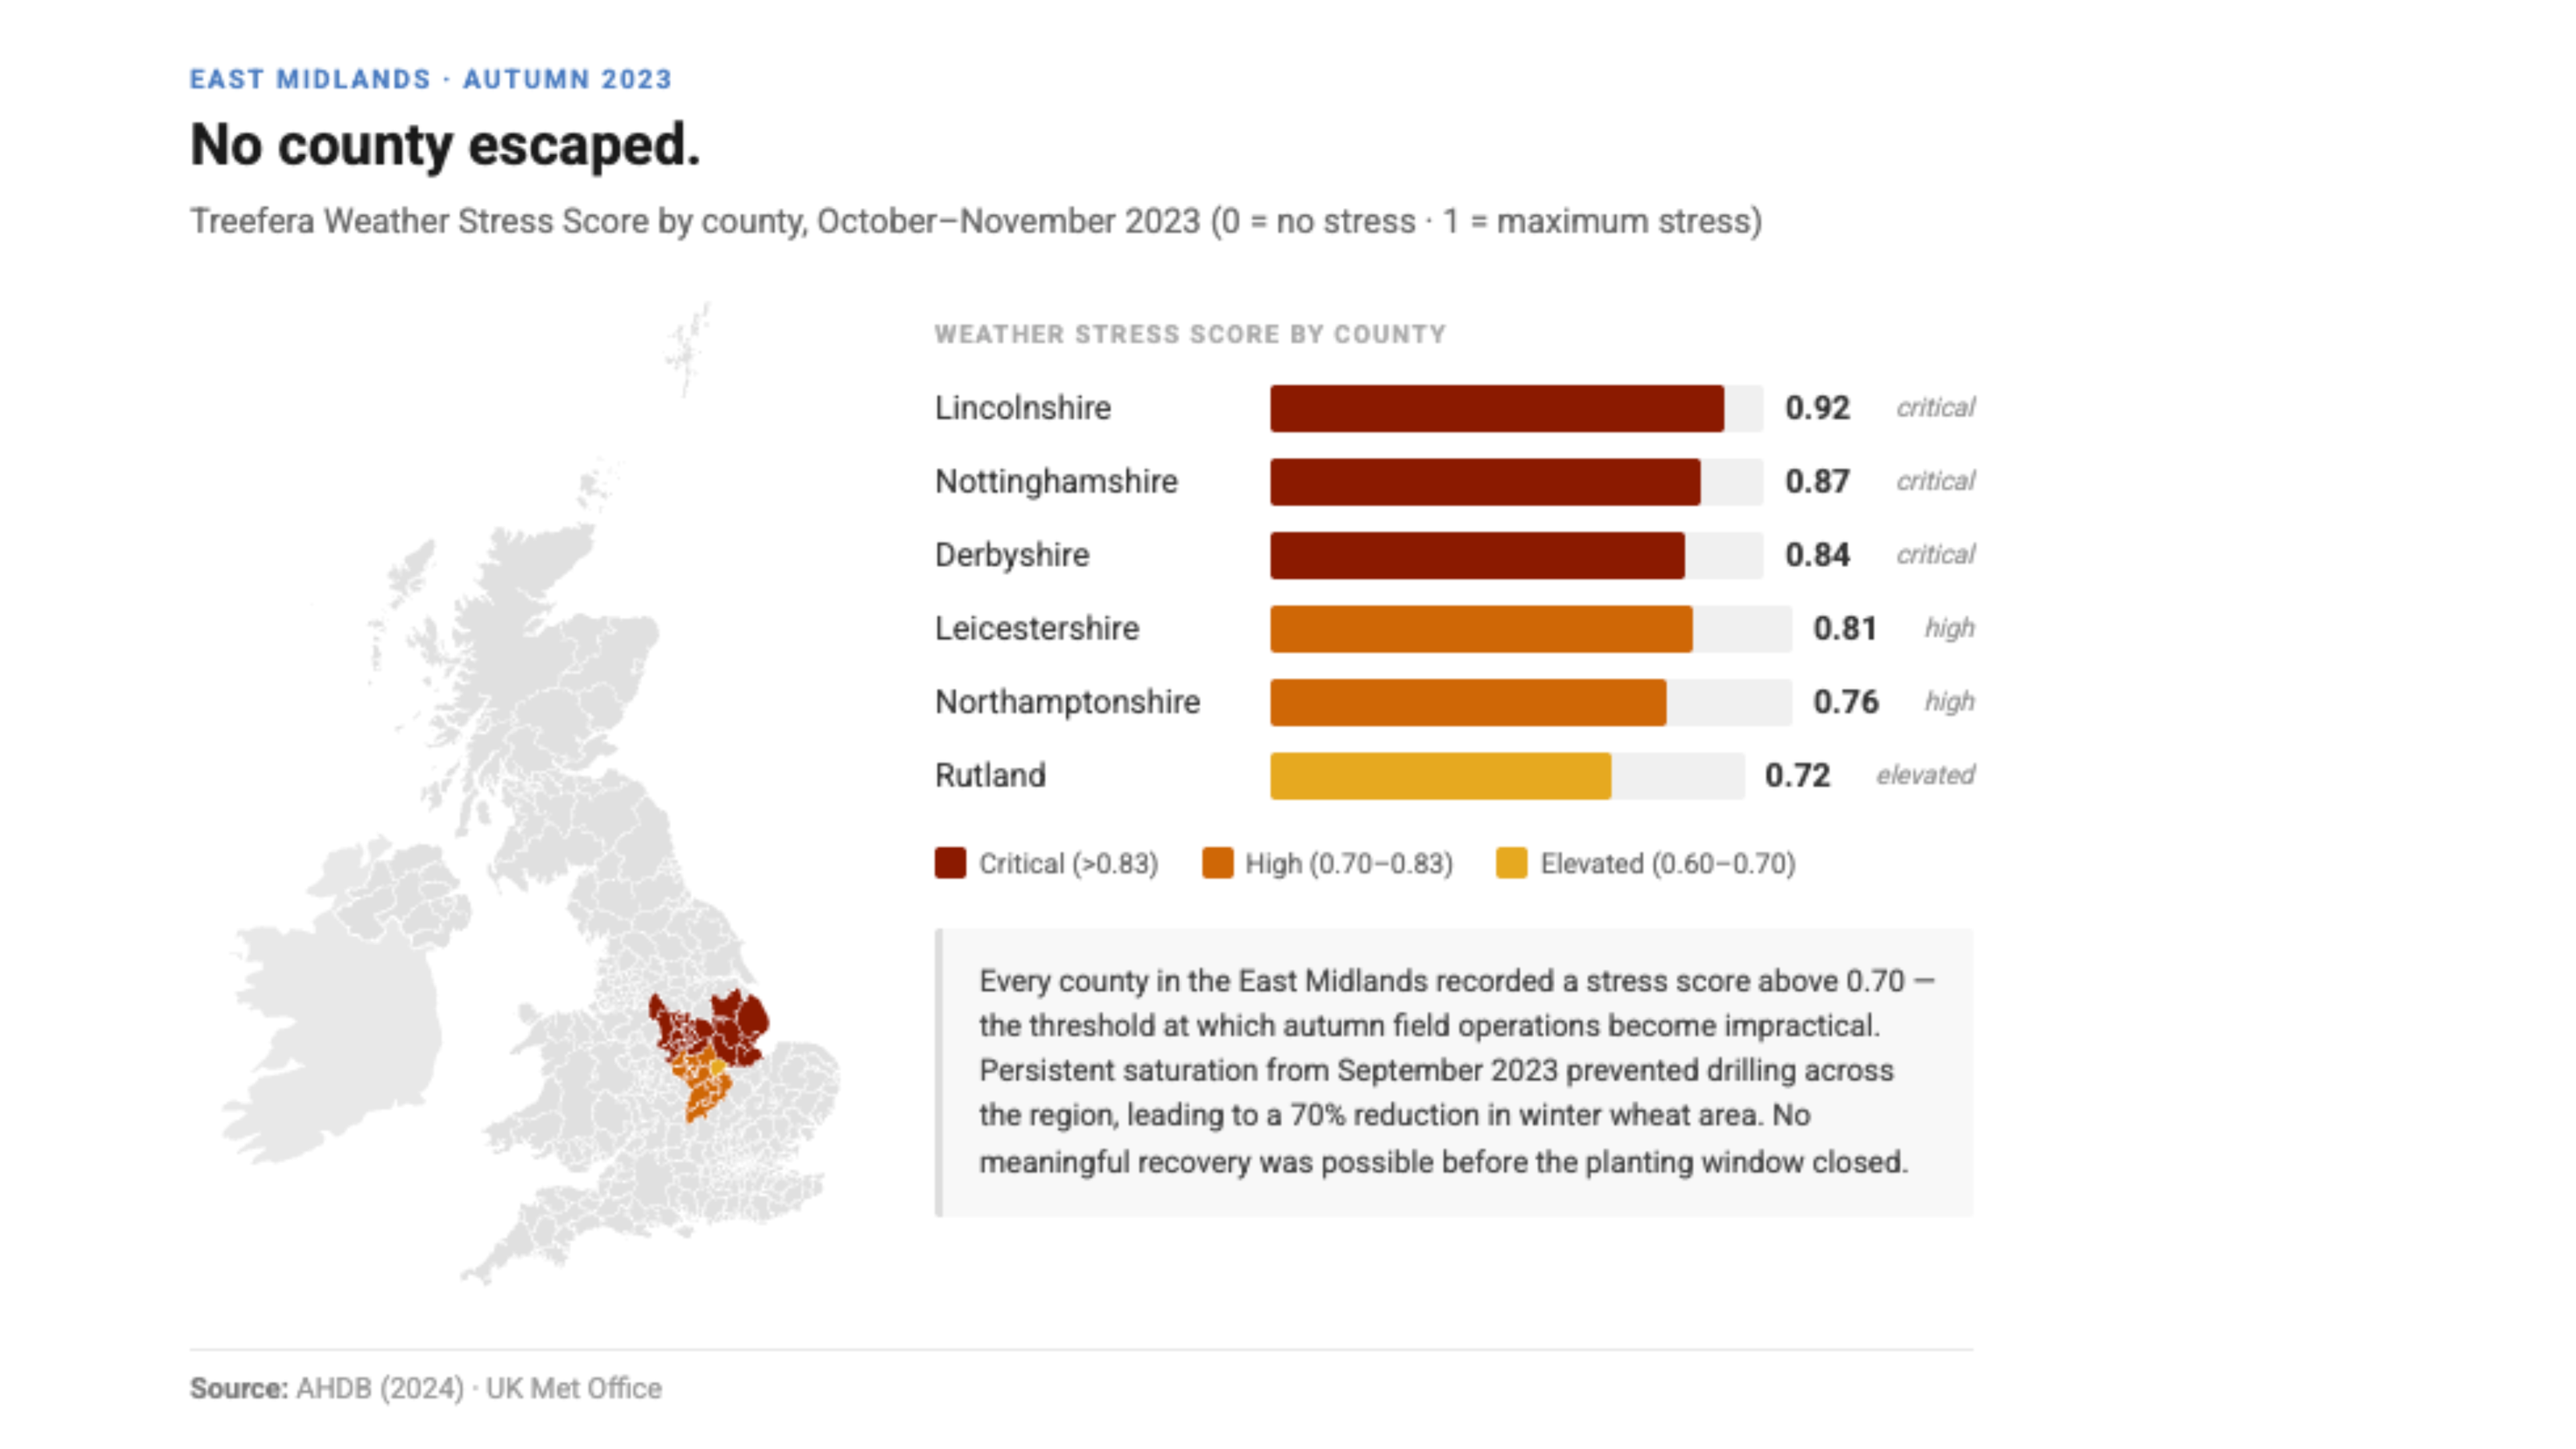
No county escaped. Source: AHDB (2024) - UK Met Office
Climate science has long documented these non-linear responses. Schlenker and Roberts demonstrated in 2009 that crop yields respond non-linearly to temperature – decline above the optimum is significantly steeper than improvement below it¹³. More recent research confirms that wheat losses accelerate beyond warming thresholds, shifting from 6.1% to 8.2% per degree Celsius¹⁴.
Dr. Sarah Kapnick, Head of Climate Risk at JP Morgan, concluded in Agriculture, Soil and Trade – The Fates of Food in a Warming World – part of JP Morgan's Climate Intuition series, with data and visualisations provided by Treefera – that environmental threats and shifting trade dynamics are fundamentally changing the risk landscape for agricultural commodities, and that relying on historical patterns is no longer sufficient¹⁵. That conclusion was reached with the benefit of field-level data infrastructure of precisely the kind this paper argues the UK lacks. If pattern-matching is failing at that level of resource and rigour, the implications for farmers working from field observation and seasonal intuition alone are significant.
There is a reason the structural under-reaction to this persists. Humans are wired to extrapolate linearly. We systematically underestimate non-linear change – even when presented with the data. This is in our biology, and it means that under-reaction to accelerating agricultural risk is predictable – which also means it is addressable, if we build systems that compensate for it.
Beyond the farm gate
Food security is not a farming problem alone. It sits on bank balance sheets, in regulatory frameworks, and across the supply chains of every sector that sources, processes or distributes food – manufacturing, retail and logistics included.
The Bank of England's Supervisory Statement SS1/29, in place since 2020, established the expectation that banks identify, measure and manage material financial risks from physical climate change¹⁶. SS5/25, published by the Prudential Regulation Authority in December 2025, extended that framework – requiring geographic and sector-specific granularity in physical risk assessments¹⁷. Banks must submit a compliance plan by June 2026. The 2021 Climate Biennial Exploratory Scenario had already identified agriculture as a sector where physical risk impairment rates would increase materially¹⁸. The data those assessments depend on – annual, regional, months-late – was designed for a different era.
A farmer's best in-season yield estimate comes from what they can observe in their own fields – a skill honed over decades and not to be underestimated. But the price they sell that crop for is not determined by their own fields. It is determined by what is happening in the US Corn Belt, in the Black Sea basin, in competing growing regions they cannot see. Better data restores the information balance. Short-term, it improves decisions about when to sell, whether to hedge, and whether to accept spot prices or hold for forward contracts. Medium-term, it supports better decisions about inputs, rotations and practice change – grounding those choices in observed performance rather than assumption.
That information balance matters not just for individual decisions – it is the foundation on which longer-term resilience gets built.
The resilience question
Farmers can build resilience. A 2024 meta-analysis found that optimised cover crops could increase equivalent global crop production by 97.7 million tonnes annually¹⁹. But transitions take three to six years to deliver results, cost EUR 2,000–5,000 per hectare, and only a small share of European regenerative transition funding needs is currently covered²⁰.
Capital providers need evidence that practice changes work – field-level yield data showing measurable improvement against comparable peers. That evidence depends on data that is not yet being systematically collected.
In December 2025, Lloyds Bank launched an Agricultural Transition Finance loan²¹. The intent is right. Its effectiveness will depend on whether the data exists to underwrite it properly.
Closing the gap
The infrastructure this paper describes has a precedent. Credit bureaus were not created by government mandate. They were built by private actors who identified a market need – the aggregation of dispersed credit data into a standardised infrastructure that lenders could use to make better decisions. The market used what they built. Regulation followed. Agricultural risk intelligence is at an analogous point. The data to assess farm-level climate and production risk exists – in satellite imagery, in insurance records, in the yield histories sitting on farm management software across the country. What has not yet been built is the aggregated, standardised infrastructure that makes that data usable by banks, insurers and regulators at portfolio scale.
Private actors have both the capability and the incentive to build it. Government's role is to create the conditions that make that investment viable and to be a credible consumer of the results. The capability already exists across the technology sector – in satellite operators, agri-tech platforms, and AI-native intelligence firms. What is missing is the aggregation layer that makes it usable at portfolio scale.
"Food security is national security," said Daniel Zeichner. The UK government's allocation of £50 million through the Farming Equipment and Technology Fund and £70 million for the Farming Innovation Programme signals genuine awareness²². But awareness cannot substitute for the data infrastructure that makes those commitments legible – that allows us to measure whether interventions are working, at field level, in season.
The infrastructure question is no longer primarily technical. AI capability is compounding at a rate that would have seemed implausible even 3 years ago – doubling roughly every 200 days. Models that required years of training and specialist infrastructure to build can now be deployed in days. Satellite constellations that once served defence and intelligence agencies are commercially available. The same tools that allow a technology company to nowcast retail footfall or logistics throughput can be pointed at a wheat field in Lincolnshire.
This is one of those moments – rare in any generation – where the capability to solve a problem at genuine scale arrives faster than the institutions designed to address it. The data infrastructure this paper describes is not a distant aspiration. It is an engineering and organisational challenge, and those are the kind of challenges the technology sector is built to solve. The real question is whether the will exists to direct that capability here – toward one of the most consequential real-world problems of the next fifty years.
The next difficult season is not a question of whether, but when. When it arrives, the decisions made in response – by farmers negotiating grain prices, by banks stress-testing agricultural portfolios, by DEFRA assessing food supply resilience – should be made on data that is current, granular and predictive. That capability exists today.
The tools are built. The case is made. The only question is how quickly we make this the standard.
This is the first in a series of three articles examining food security. The next piece examines the state of US food security and implications to Financial Systems.
References
- DEFRA / AHDB (2025). UK wheat balance sheet data 2024/25. AHDB Early Balance Sheets 2025/26, December 2025.
- DEFRA (2025). Agriculture in the United Kingdom 2024. Department for Environment, Food & Rural Affairs, July 2025.
- DEFRA (2025). Cereal and Oilseed Production 2025. Department for Environment, Food & Rural Affairs, October 2025.
- AHDB (2026). Early Balance Sheets 2025/26. Agriculture and Horticulture Development Board, January 2026.
- DEFRA (2020–2025). Historical cereal and oilseed production data. Department for Environment, Food & Rural Affairs.
- AHDB. Cereals Market Insight. Agriculture and Horticulture Development Board. Published throughout growing season.
- USDA NASS. Crop Progress (weekly, April–November). USDA Office of Chief Economist. World Agricultural Supply and Demand Estimates (WASDE, monthly). United States Department of Agriculture.
- USDA RMA (2025). Summary of Business. United States Department of Agriculture Risk Management Agency.
- Corcoran, E. et al. (2023). Current data and modeling bottlenecks for predicting crop yields in the United Kingdom. Frontiers in Sustainable Food Systems, 7, article 1023169. DOI: 10.3389/fsufs.2023.1023169.
- Dimbleby, H. (2021). National Food Strategy: The Plan. nationalfoodstrategy.org, July 2021.
- DEFRA / industry estimates (2020–2025). Estimated cumulative losses from UK harvest disruptions, 2020–2025.
- AHDB (2024). Autumn drilling progress and crop establishment reporting. Agriculture and Horticulture Development Board.
- Schlenker, W. and Roberts, M.J. (2009). Nonlinear temperature effects indicate severe damages to U.S. crop yields under climate change. Proceedings of the National Academy of Sciences, 106(37), pp.15594–15598. DOI: 10.1073/pnas.0906865106.
- Tran, B.-L., Tseng, W.-C. and Chen, C.-C. (2025). Climate change impacts on crop yields across temperature rise thresholds and climate zones. Scientific Reports, 15, article 23424. DOI: 10.1038/s41598-025-07405-8.
- Kapnick, S. (2026). Agriculture, Soil and Trade — The Fates of Food in a Warming World. J.P. Morgan Climate Intuition series, 16 January 2026. Data and visualisations: Treefera.
- Bank of England Prudential Regulation Authority (2020). Supervisory Statement SS1/29: Enhancing banks' and insurers' approaches to managing the financial risks from climate change. Bank of England.
- Bank of England Prudential Regulation Authority (2025). Supervisory Statement SS5/25: Managing the financial risks from physical climate change. Bank of England, December 2025.
- Bank of England (2022). Climate Biennial Exploratory Scenario: Key elements of the 2021 CBES. Bank of England.
- Qiu, T. et al. (2024). Optimizing cover crop practices as a sustainable solution for global agroecosystem services. Nature Communications, 15(1), article 10617. DOI: 10.1038/s41467-024-54536-z.
- WBCSD (2024). Regenerative agriculture: transition costs and European funding gap. World Business Council for Sustainable Development.
- Lloyds Bank (2025). Agricultural Transition Finance product launch. December 2025.
- HM Treasury / DEFRA (2025). Farming Equipment and Technology Fund; Farming Innovation Programme. UK Government.