Agricultural Risk Intelligence
See seven months of crop risk in your sourcing regions, before your commitments are set. Forward-looking data on where and when weather risk is building in the regions you source from, scored at the growth stages when the crop is most vulnerable and broken down by zone, hazard and driver.
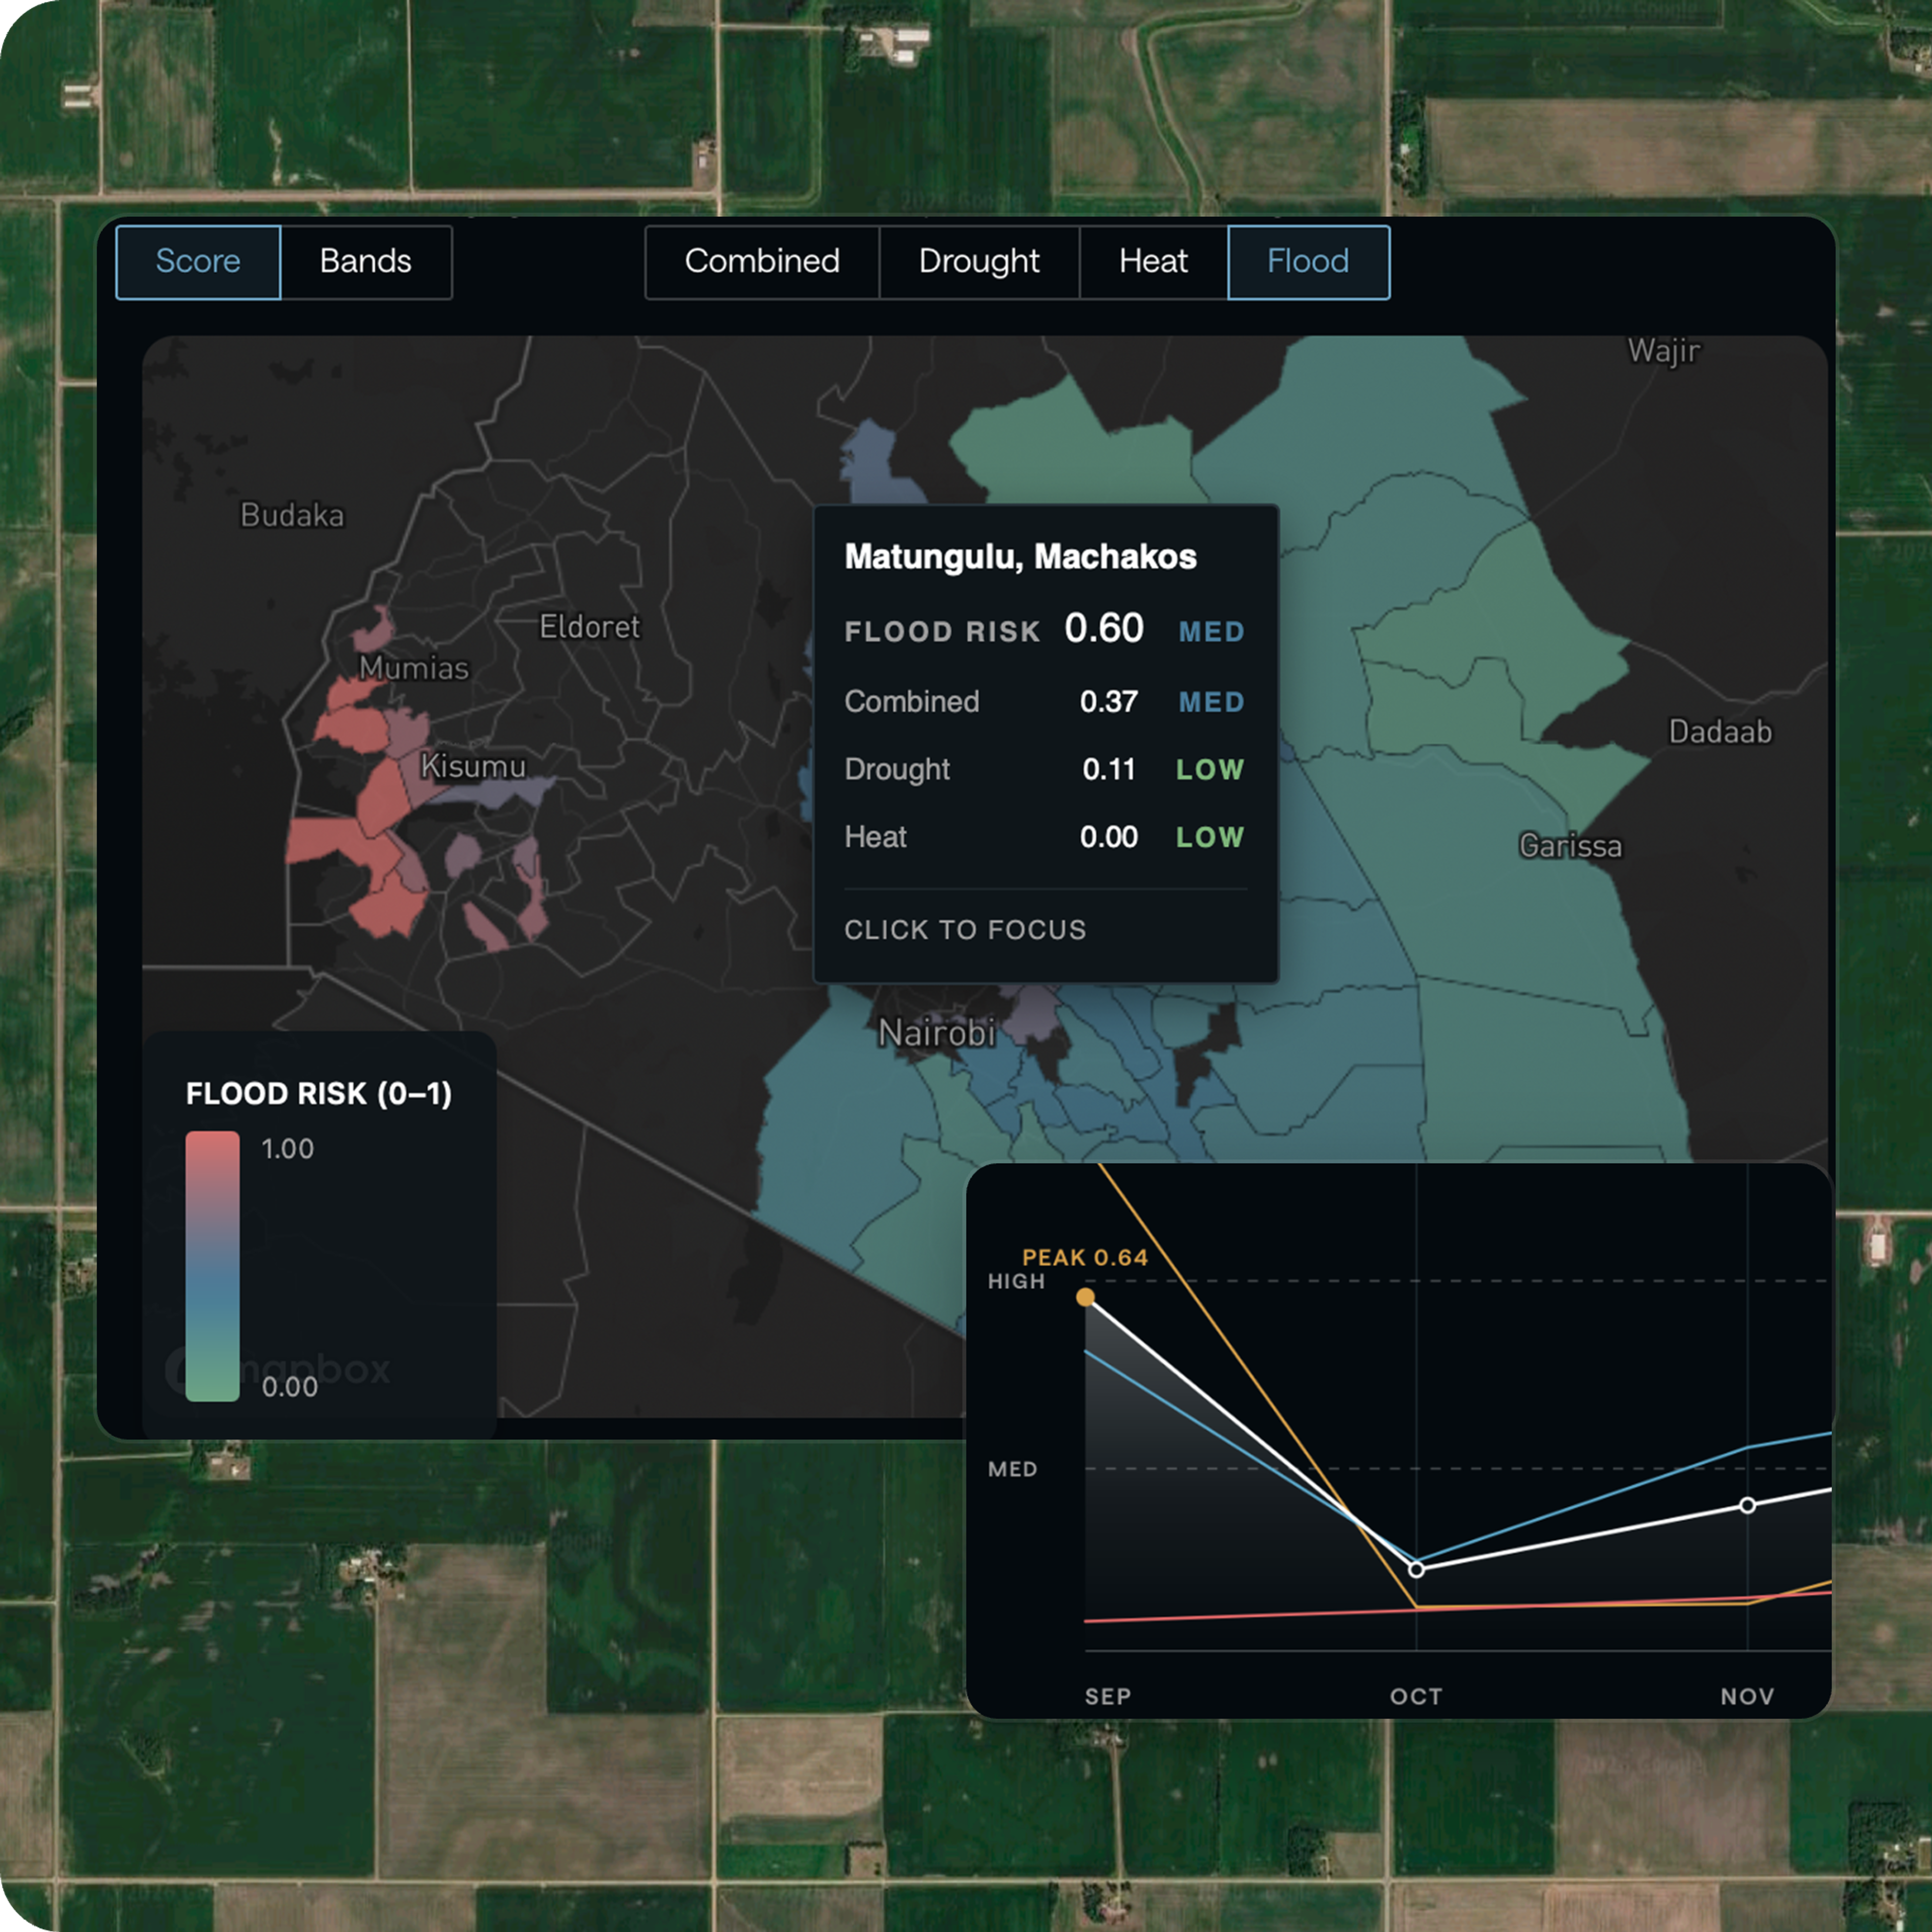
Sourcing teams have no single view of weather risk across the regions they buy from.
Sourcing teams plan the season ahead from weather forecasts, price forecasts, agronomist advice and government bulletins. These sources use different scales and timelines and most report risk by calendar month instead of by crop growth stage, so a dry spell at flowering reads the same as a dry spell after harvest. Without an independent view of weather & climate volatility that compares every sourcing region on the same basis, volume is committed and supplier contracts are signed before the risk is clear.
The Treefera Advantage
What Treefera gives you
- Seven months of forward read, before commitments are set
- Risk scored at the crop's growth stages
- A score for every zone, down to county-level
- Read against the crop's season timeline
- Every score broken down by hazard and driver
- Refreshed monthly with an audit trail
What traditional planning tools give you
- A read on the season only after it has happened
- Risk reported by calendar month
- One figure for the whole country
- Fixed calendar dates, not growth stages
- A single headline number, with no drivers shown
- Last year's averages, updated after official reports
What Treefera gives you
- Seven months of forward read, before commitments are set
- Risk scored at the crop's growth stages
- A score for every zone, down to county-level
- Read against the crop's season timeline
- Every score broken down by hazard and driver
- Refreshed monthly with an audit trail
What traditional planning tools give you
- A read on the season only after it has happened
- Risk reported by calendar month
- One figure for the whole country
- Fixed calendar dates, not growth stages
- A single headline number, with no drivers shown
- Last year's averages, updated after official reports
Weather risk scored for the crop, the region and the growth stage.
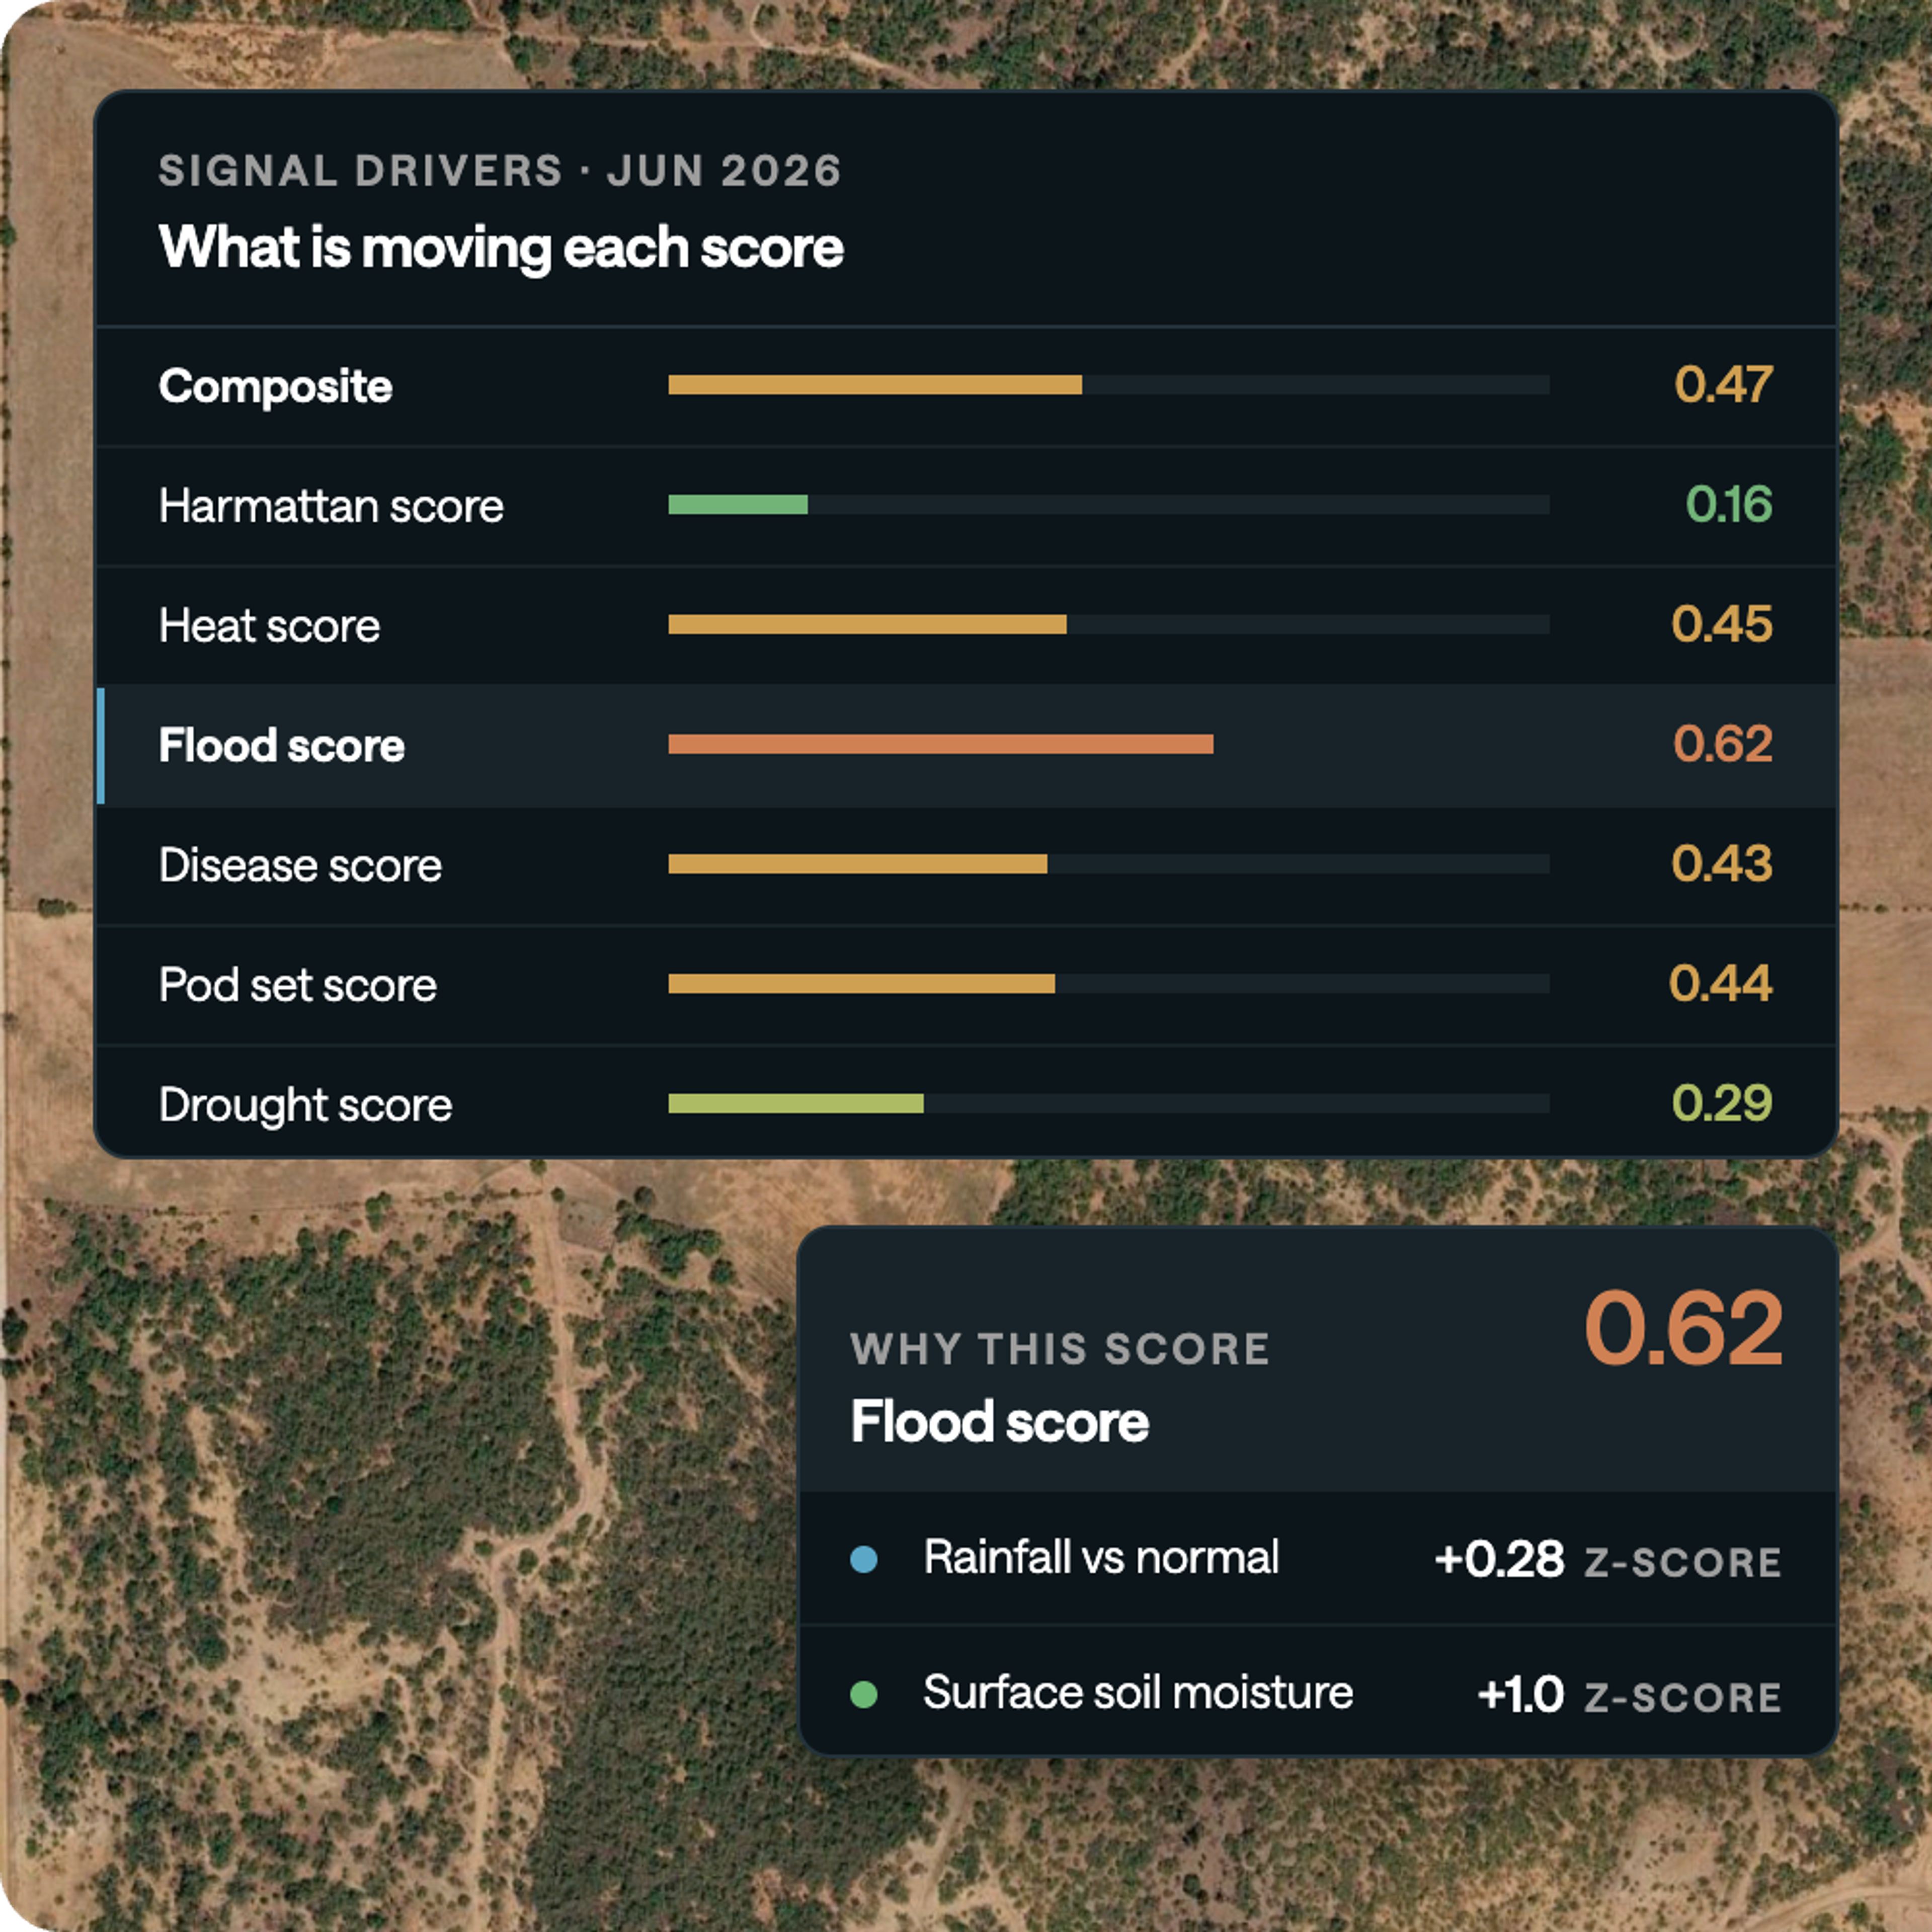
One score, broken into its hazards and weighted by growth stage
One composite score per zone (0 to 1)
That accumulates across the season, so you see how stress is building rather than a single snapshot.
Decomposed into its hazards
Like drought, heat, excess water and cold, each with the drivers behind it, so you can see which peril is driving a zone's score.
Weighted by growth stage
A hot week at pollination counts far more than the same week after harvest. The composite is not a simple average of the hazards. If one hazard is serious, the score stays high rather than being diluted by the calmer ones.

A better-informed decision now, instead of a large loss later.
For a business with $100M in corn production, moving 10% of volume ($10M) from high-risk to low-risk zones is about a $2M impact on P&L.
Resources

COMPANY NEWS
17 February 2026
Treefera launches Market Intelligence for Agricultural and Soft commodities
Treefera launched Market Intelligence, a new data product delivering yield and production area forecasts expressed as probabilistic ranges with quantified uncertainty, across seasonal and multi-year h…


FAQ
Agricultural Risk Intelligence gives seed and crop-science companies a forward-looking, evidence-based read on crop stress. It scores risk by zone and by growth stage, up to seven months ahead of the season, so allocation and sourcing decisions can be made on current evidence rather than historical averages